Air pollution remains one of the most significant environmental health risks facing the globe. An analysis of projected Air Quality Index (AQI) data for 2025 reveals a deeply concerning trend, particularly centered in South Asia. The data, based on the US AQI standard, highlights a severe and persistent crisis affecting millions of urban residents.
This analysis examines the top 10 most polluted cities for 2025, providing both an overview of the collective situation and a deeper dive into specific municipal data to understand the seasonal dynamics of this environmental challenge.
Top 10 World’s Most Polluted Cities 2025 – AQI (US)
| City (Rank) | Annual Avg. AQI 2025 | Highest AQI (Month) | Lowest AQI (Month) |
| 1. Ghaziabad, India | 183 | 422 (December) | 86 (July) |
| 2. New Delhi, India | 177 | 364 (December) | 95 (July) |
| 3. Faridabad, India | 174 | 388 (December) | 83 (July) |
| 4. Noida, India | 172 | 402 (December) | 90 (July) |
| 5. Sonipat, India | 171 | 385 (December) | 85 (July) |
| 6. Greater Noida, India | 167 | 389 (December) | 82 (July) |
| 7. Baghpat, India | 164 | 362 (December) | 77 (July) |
| 8. Gurgaon, India | 163 | 323 (December) | 96 (July) |
| 9. Rohtak, India | 162 | 357 (December) | 76 (July) |
| 10. Karnal, India | 161 | 362 (November) | 79 (July) |
Data Source: www.aqi.in
1. The ” Delhi NCR Trap”: Geographical Monopoly
The most striking insight is the total dominance of the National Capital Region (NCR) and its immediate neighbors in the top 10. Pollution is not just a “city” problem; it is a regional atmospheric phenomenon.
- Insight: The pollution doesn’t stop at city borders. The entire 200km stretch from Karnal (Haryana) down to Greater Noida (UP) acts as a single, continuous “pollution corridor.” If you are in this zone, there is virtually no escape from the smog during the winter months.
2. The November vs. December Peak (The “Stubble vs. Smog” Shift)
There is a subtle but important shift in when cities hit their worst levels:
- The “Agricultural” Peak (November): Cities further north like Karnal peak in November (AQI 362) and actually see a decrease in December. This correlates directly with the post-harvest stubble burning season in the agricultural belts of Punjab and Haryana.
- The “Urban/Climatic” Peak (December): Cities like Ghaziabad and Noida see their worst air in December (AQI 422 and 402 respectively). This suggests that while stubble burning kicks off the crisis, the extreme cold and stagnant winds of December trap local urban pollutants (traffic and industry) even more effectively than the agricultural smoke.
3. The True Seasonality of Pollution: A Corrected Analysis
1. The Peak Danger Phase (4 Months: October – January)
This phase represents the most hazardous time of the year, characterized by a sharp, aggressive climb in pollutants.
- October Transition: The crisis begins in October as AQI levels nearly double from September, crossing into the “Unhealthy” range (averaging 176 to 219).
- November & December Extremes: These are the deadliest months. November peaks as high as 389 (Ghaziabad), while December reaches critical levels up to 422.
- January Hangover: Pollution remains severe in January, with several cities like New Delhi maintaining an average AQI over 200.
- Impact: During these four months, the air is frequently in the “Severe” or “Hazardous” categories, making even short-term outdoor exposure a significant health risk.
2. The Chronic Mid-Level Phase (5 Months: February – June)
During this period, air quality is consistently “Unhealthy,” but it avoids the extreme hazardous peaks seen in early winter.
- AQI Range: For most cities, the average remains stuck between 110 and 190.
- Consistency: Unlike the winter peak, this phase is more stable. For example, Faridabad hovers between 121 and 154 from February through June.
- Driving Factors: The pollution during these months is largely driven by urban activity, vehicular emissions, and rising summer dust, as opposed to the stagnant weather and crop burning of winter.
- Impact: While not an immediate emergency, this represents a five-month period of constant exposure to poor air quality for millions of residents.
3. The Relief Window (3 Months: July – September)
This is the only time of year when residents breathe air that is statistically “Moderate” rather than “Unhealthy”.
- Annual Lows: July is universally the cleanest month across all top 10 cities, with AQI levels dropping to their lowest points, such as 79 in Baghpat and Karnal.
- The Monsoon Scrub: August and September continue this trend, with values generally staying below 100.
- Impact: This three-month window is the only period where air quality meets the “Moderate” standard (51-100), providing the lungs a brief and necessary recovery before the October climb begins again.
Top 10 Cities Data Analysis – AQI Ranking 2025
A closer look at the leading cities on this list reveals the depth of the problem.
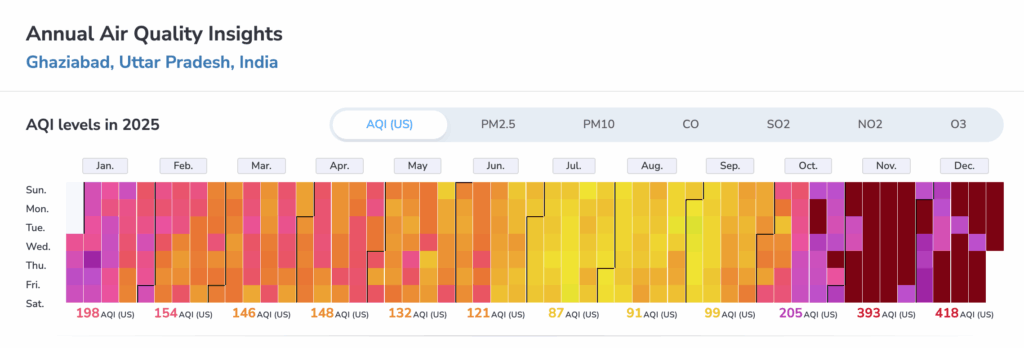
1. Ghaziabad, India
- Annual Average AQI: 183
- Pollution Profile: Ghaziabad holds the top spot as the most polluted city. Its air quality remains in the “Unhealthy” range for most of the year.
- Monthly Extremes: The city hits a severe peak in December with an AQI of 422, followed by November at 389. Its cleanest month is July (AQI 86), which is still on the higher side of the “Moderate” category.
- Analysis: As a major industrial and residential hub bordering Delhi, Ghaziabad suffers from a combination of industrial emissions, heavy vehicular traffic, and construction dust that is trapped by stagnant winter winds.
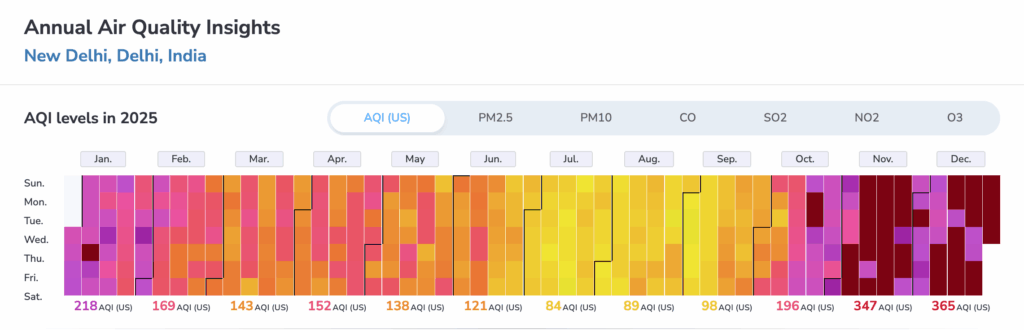
2. New Delhi, India
- Annual Average AQI: 177
- Pollution Profile: The capital city ranks second. It shows the most consistent high-pollution levels throughout the winter months.
- Monthly Extremes: December is the worst month at 364, while January (218) is significantly higher than most other cities on this list. July and August are the only months where the air quality dips into the double digits (95 and 96 respectively).
- Analysis: New Delhi’s crisis is driven by its massive population density and geographic location, which acts as a basin for pollutants from neighboring states, especially during the post-monsoon stubble burning season.
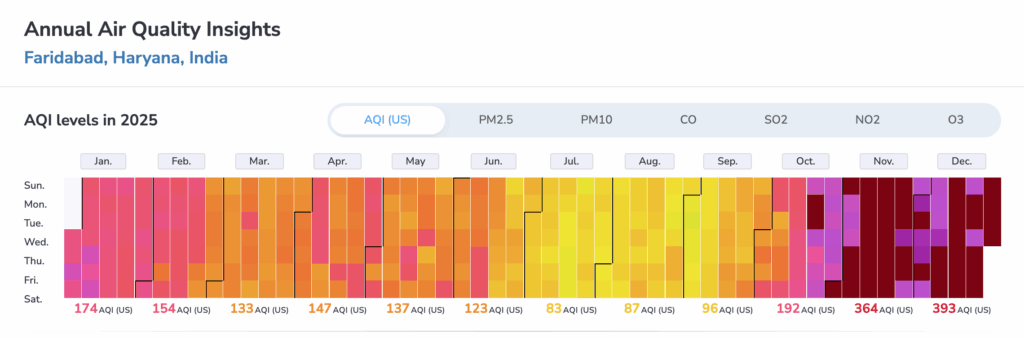
3. Faridabad, India
- Annual Average AQI: 174
- Pollution Profile: Faridabad maintains a high average due to its industrial nature.
- Monthly Extremes: November (361) and December (388) are hazardous. The city sees a rapid recovery in the monsoon, with July recording its lowest AQI of 83.
- Analysis: Being an industrial powerhouse, Faridabad’s air is heavily impacted by manufacturing units and diesel generators, alongside the regional atmospheric factors of the NCR.
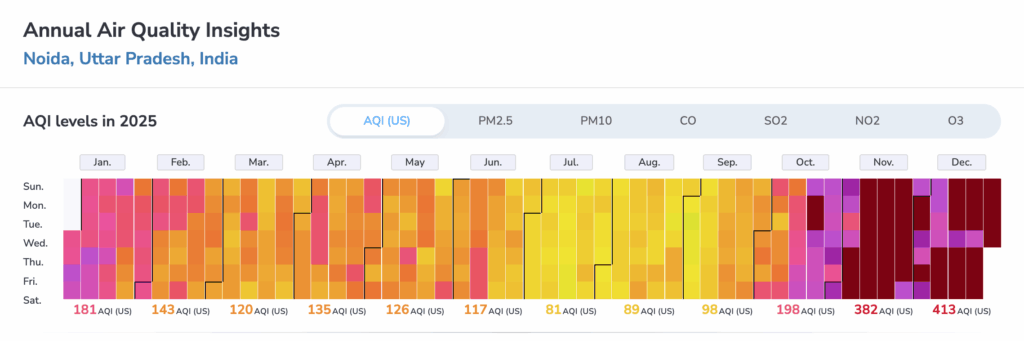
4. Noida, India
- Annual Average AQI: 172
- Pollution Profile: Noida shows a drastic jump from the “Moderate” summer air to “Hazardous” winter air.
- Monthly Extremes: December reaches a peak of 402, making it one of the few cities to average above 400 for a full month. July and August hover around 90-91.
- Analysis: The city’s air quality is heavily influenced by the construction of high-rise buildings and its proximity to major highways, which contribute significantly to PM2.5 and PM10 levels.
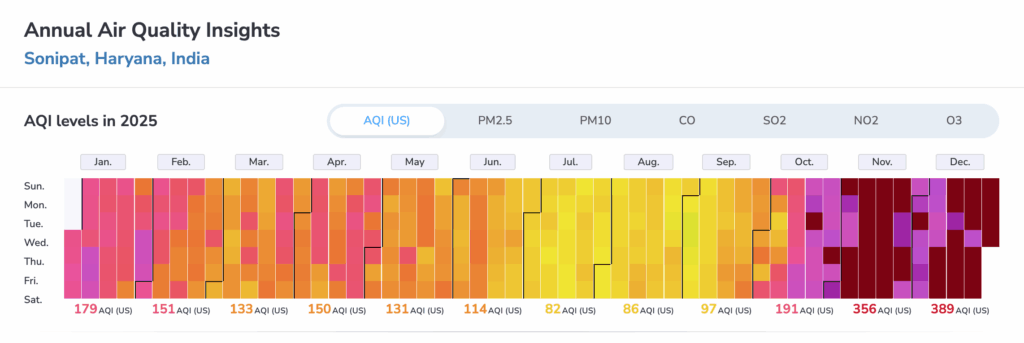
5. Sonipat, India
- Annual Average AQI: 171
- Pollution Profile: Sonipat mirrors the NCR trend but has slightly lower mid-year averages.
- Monthly Extremes: The year ends with a sharp spike in November (352) and December (385). July remains the cleanest month at 85.
- Analysis: As a gateway between the agricultural belts of Haryana and the urban sprawl of Delhi, Sonipat is uniquely affected by both agricultural residue burning and industrial transit.
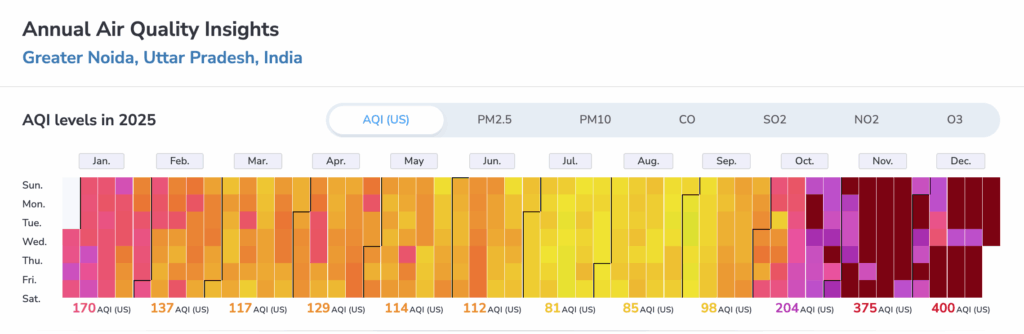
6. Greater Noida, India
- Annual Average AQI: 167
- Pollution Profile: Despite being planned with more green spaces, Greater Noida faces severe air quality challenges.
- Monthly Extremes: December is projected at 389. The city enjoys a relatively clean monsoon with a July average of 82.
- Analysis: Localized construction projects and industrial zones, combined with the “heat island” effect of the surrounding NCR, keep its AQI in the unhealthy range for the majority of the year.
7. Baghpat, India
- Annual Average AQI: 164
- Pollution Profile: Baghpat shows a very similar profile to Noida, with a massive seasonal variance.
- Monthly Extremes: The peak months are November and December (352 and 362). July provides the cleanest air of the year at 77.
- Analysis: Being largely agricultural and semi-urban, Baghpat’s pollution is heavily tied to the regional “smog blanket” that forms over Northern India in the winter.

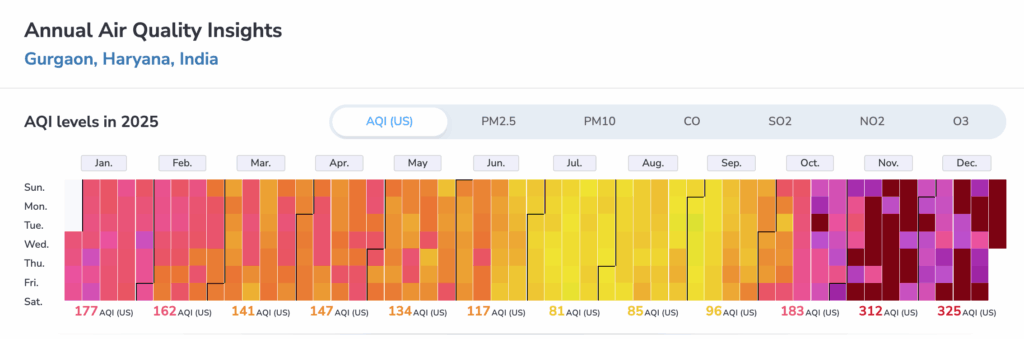
8. Gurgaon, India
- Annual Average AQI: 163
- Pollution Profile: Gurgaon’s average is slightly lower than Delhi’s, but it remains consistently unhealthy.
- Monthly Extremes: It peaks in December at 323. Interestingly, its summer and monsoon months (June-September) stay consistently around 100, which is higher than some of its neighbors.
- Analysis: The city’s pollution is dominated by vehicular emissions from its massive corporate workforce and the widespread use of diesel generators during power outages.
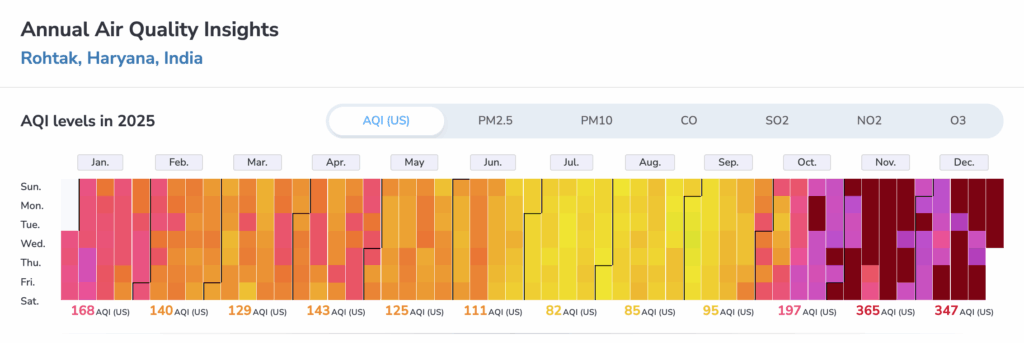
9. Rohtak, India
- Annual Average AQI: 162
- Pollution Profile: Rohtak experiences some of the cleanest summer days on this list but very harsh winters.
- Monthly Extremes: December reaches 357, while July and August are relatively low (76 and 79).
- Analysis: Rohtak’s pollution is highly seasonal, primarily influenced by the lack of wind dispersion in the winter months which traps regional pollutants over the city.
10. Karnal, India
- Annual Average AQI: 161
- Pollution Profile: Karnal rounds out the top 10 with a very high winter peak despite being further from the Delhi core.
- Monthly Extremes: It hits a high of 362 in November. Notably, it recovers faster in December (305) compared to the cities closer to the NCR center.
- Analysis: As a major center in the “Rice Bowl of India,” Karnal’s air quality is most severely impacted by the harvest season and the subsequent burning of crop residue in October and November.

Conclusion
The 2025 AQI ranking data serves as a stark, numerical testament to a severe environmental and public health crisis in Northern India. The analysis proves that while these cities may experience moderate air quality during the monsoon summer, the annual averages are heavily skewed by a dangerously toxic winter season. During November and December, millions of residents in these top ten cities are projected to live day after day in conditions classified as hazardous to human life. The data emphasizes the urgent need for sustained, year-round mitigation strategies that address the root causes driving these extreme seasonal peaks.
Also check about “Most Polluted Cities in The World 2024”.