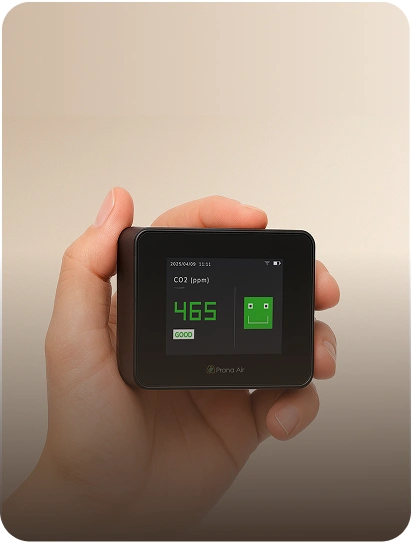
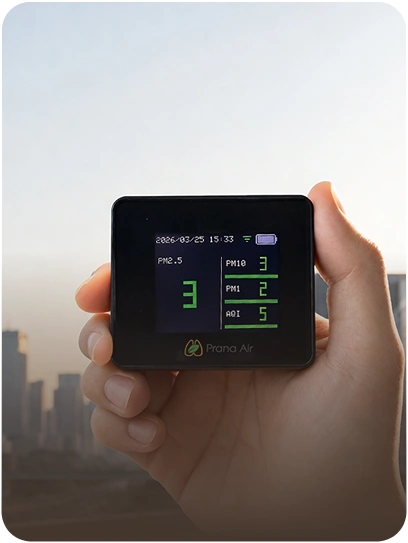
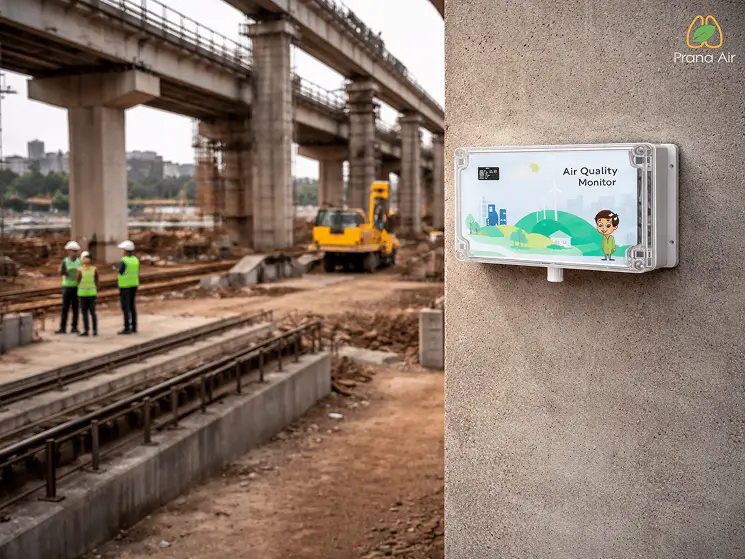

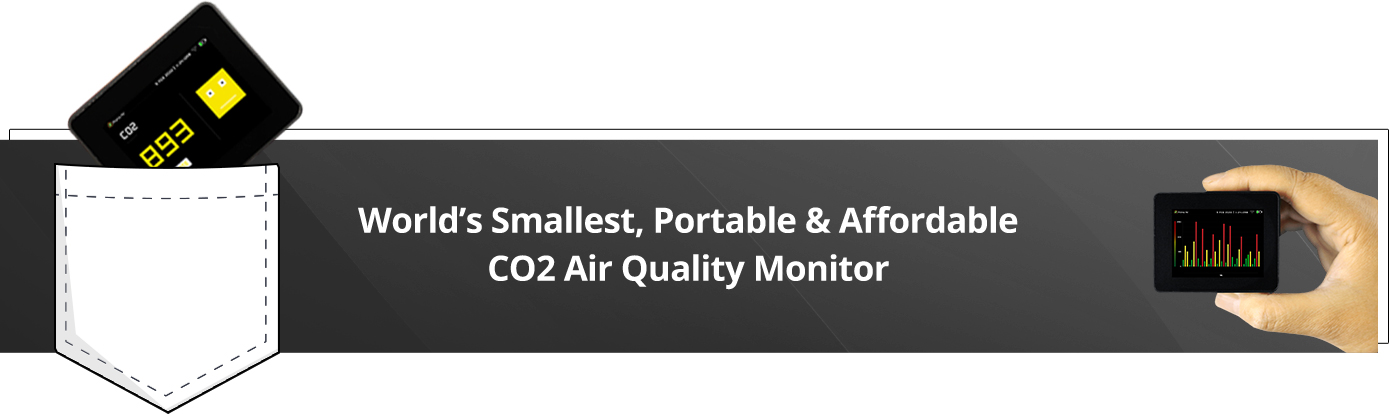
Worlds Smallest
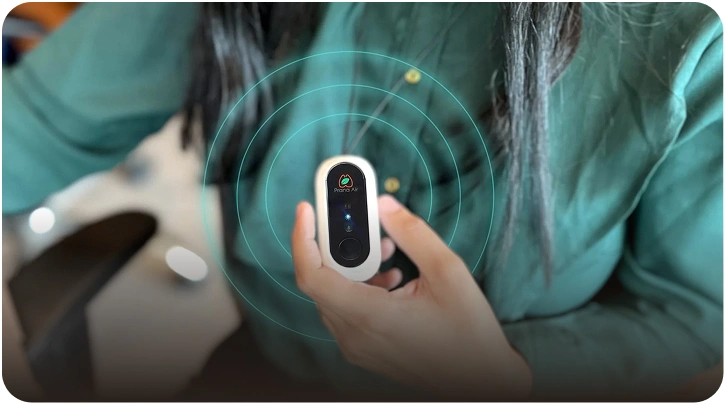
Track the real-time air quality levels on the go with our smallest, portable, and handiest pocket air monitor.
- ₹ 5990
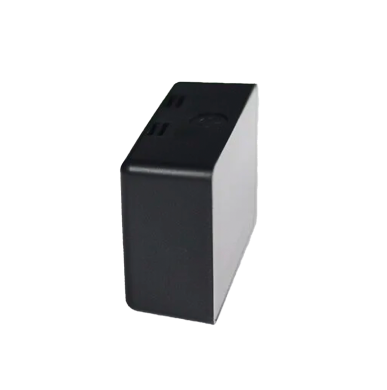
 Pocket-Sized
 Wifi Enabled
 Real-time Level
 Wi-Fi Connectivity
 Mobile App Enabled
 Portable Monitor
 LCD Display
 400 mAh Battery
![]() Compliance with LEED, WELL, and ASHRAE standards
Compliance with LEED, WELL, and ASHRAE standards
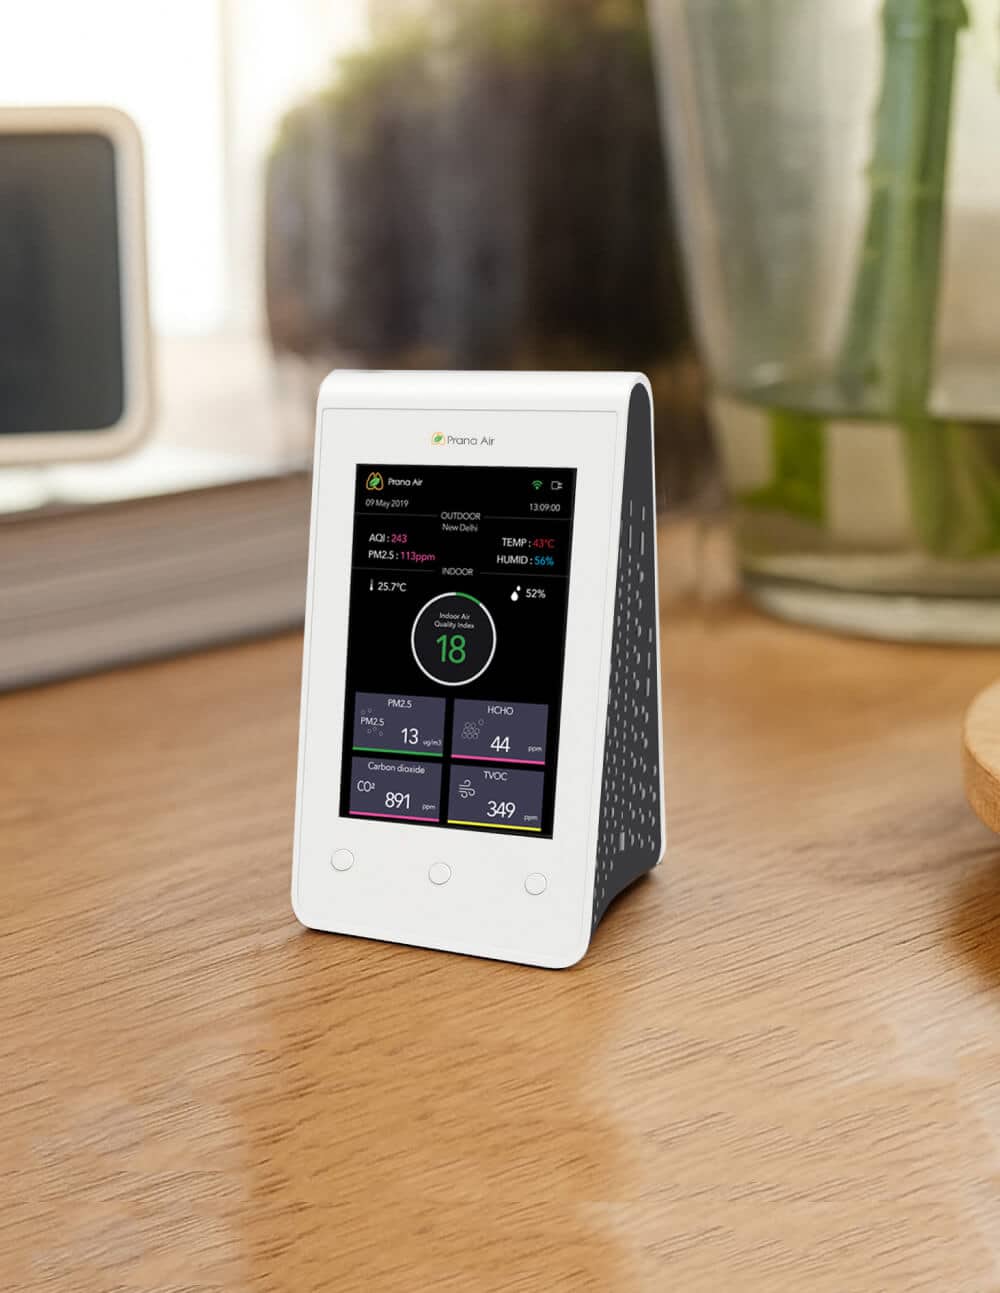
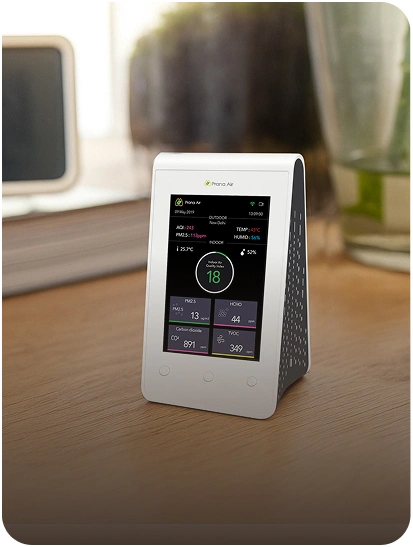
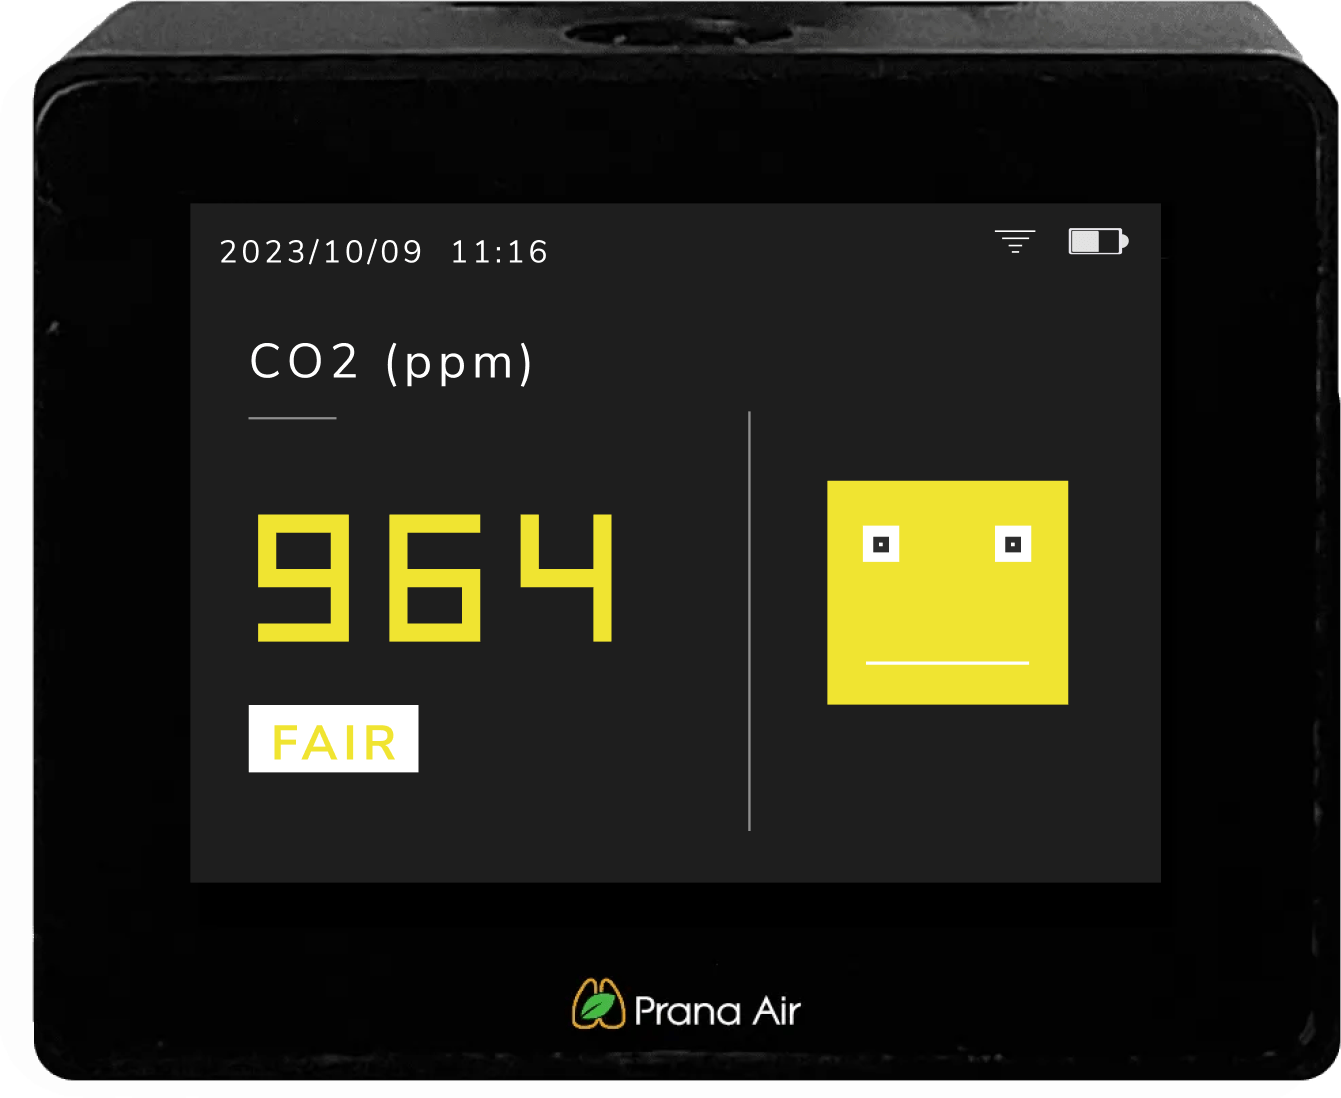
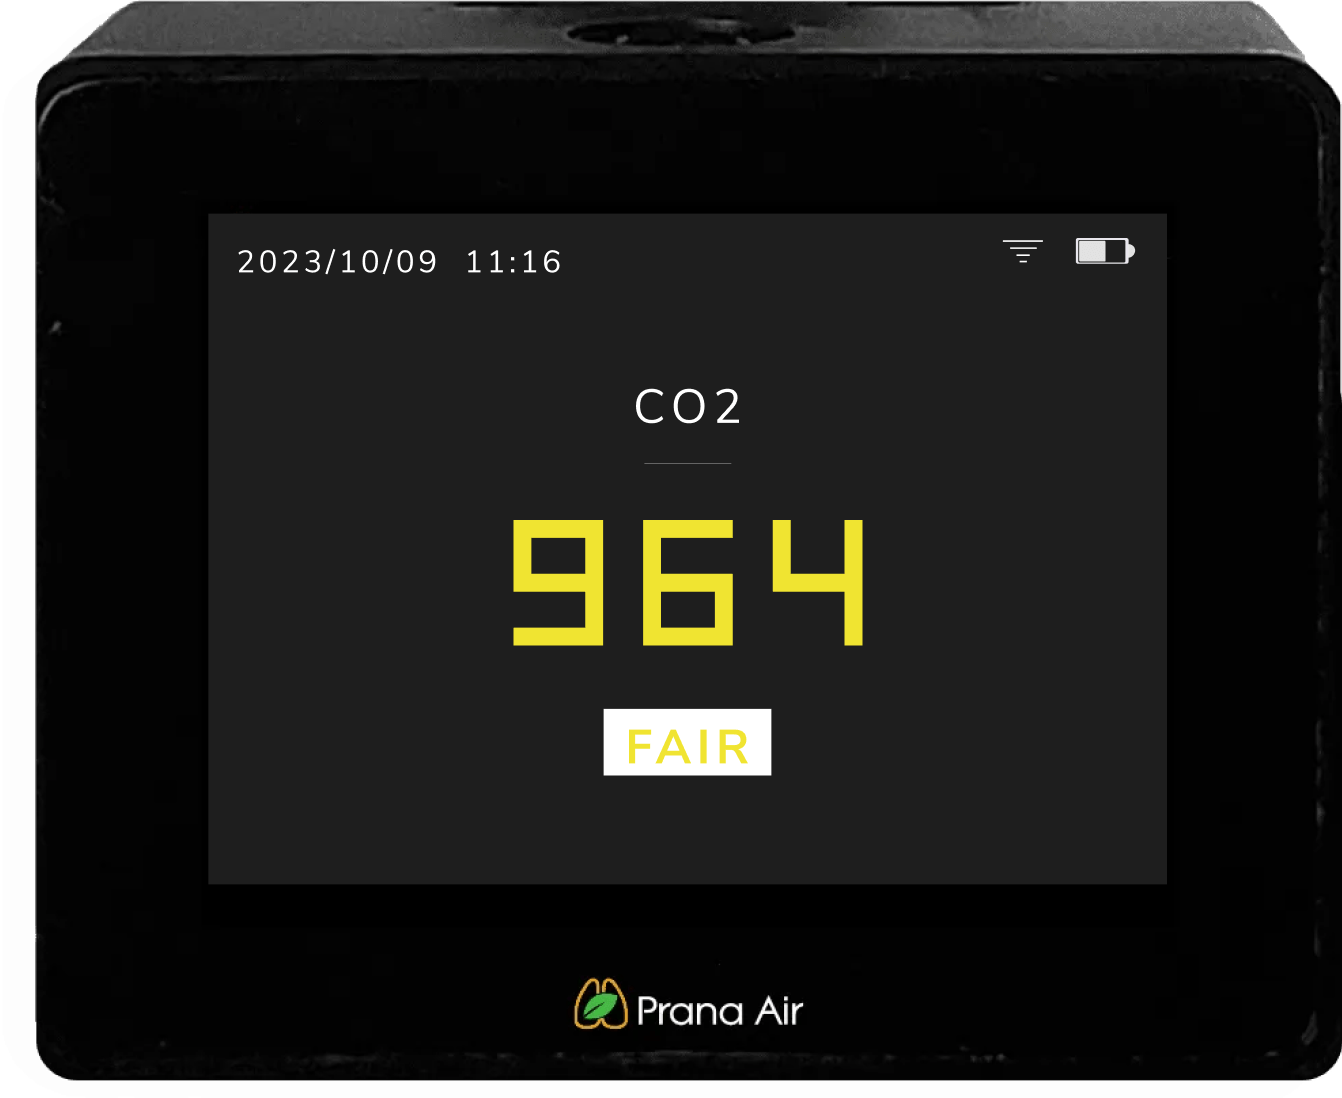
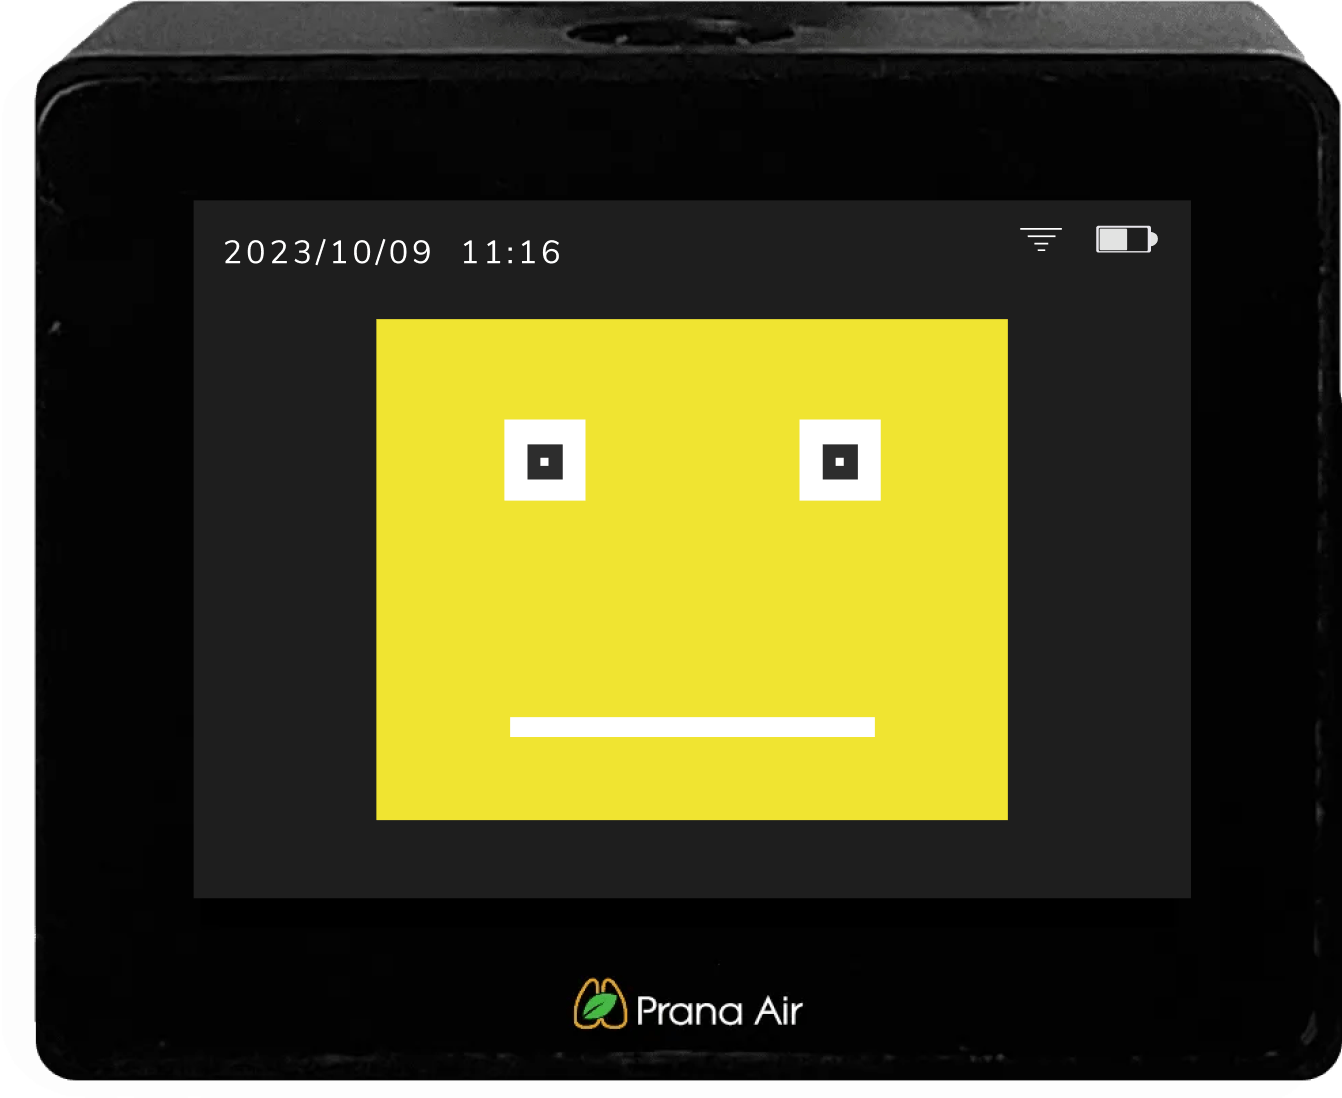
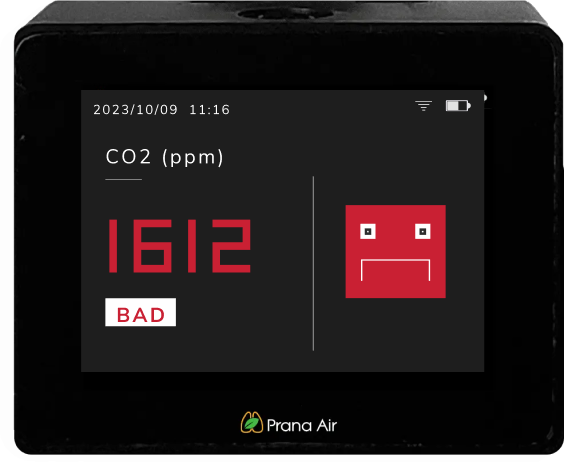
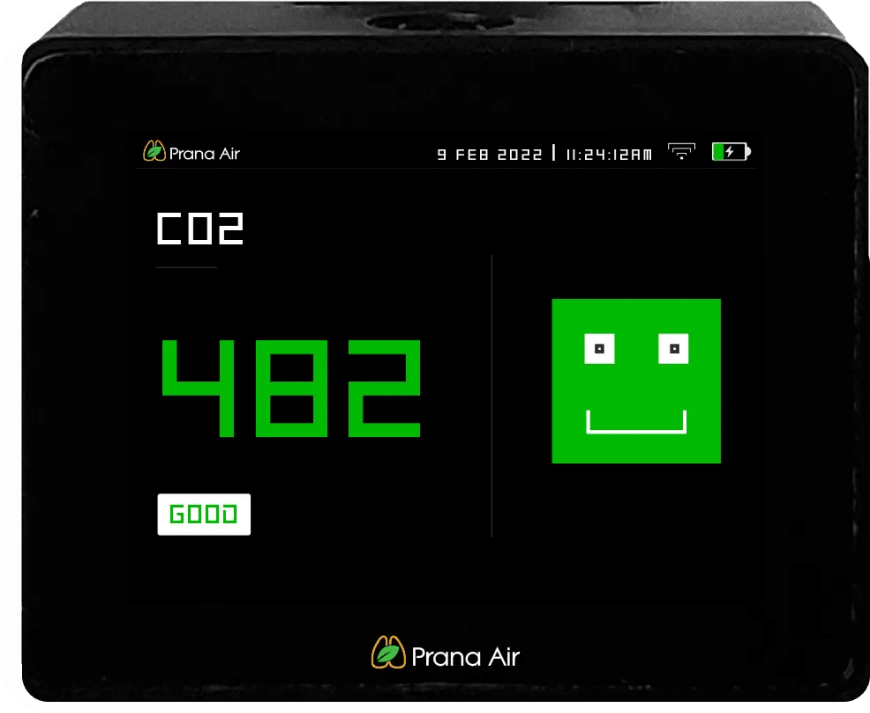
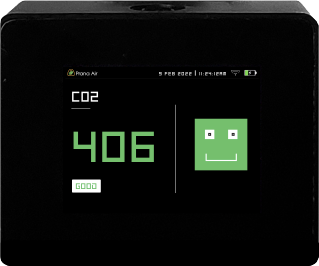
Multiple User-Interfaces
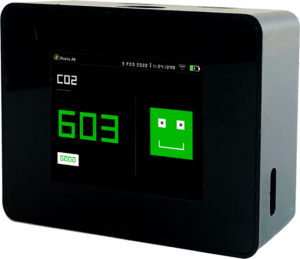
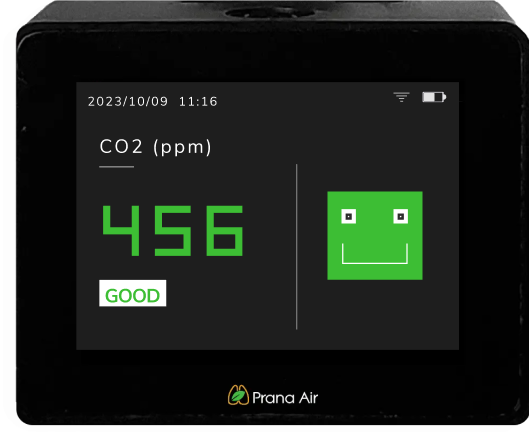
Displaying the real-time CO2 levels in the form of both the emoticon and numerical screens. Green, yellow, and red color representation.
Remote DataAccessibility
AQI data cloud storage eases the accessibility of the monitors air quality data remotely anytime anywhere wherever you go.
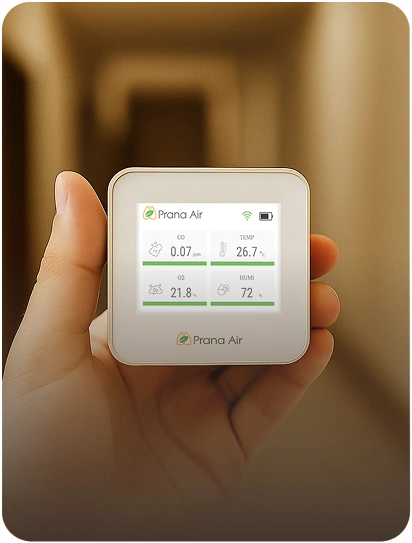
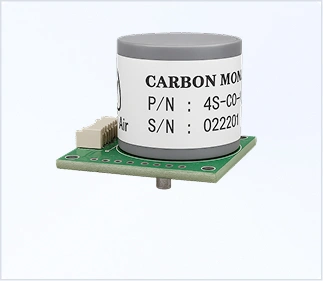
CO2 Monitor

WIFI Connectivity

AQI Cloud Server
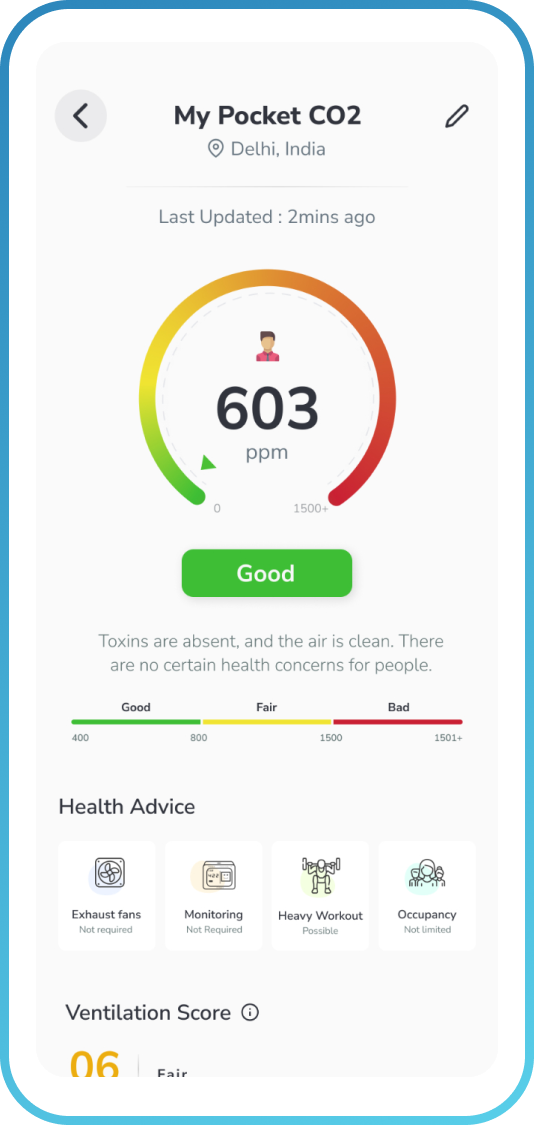
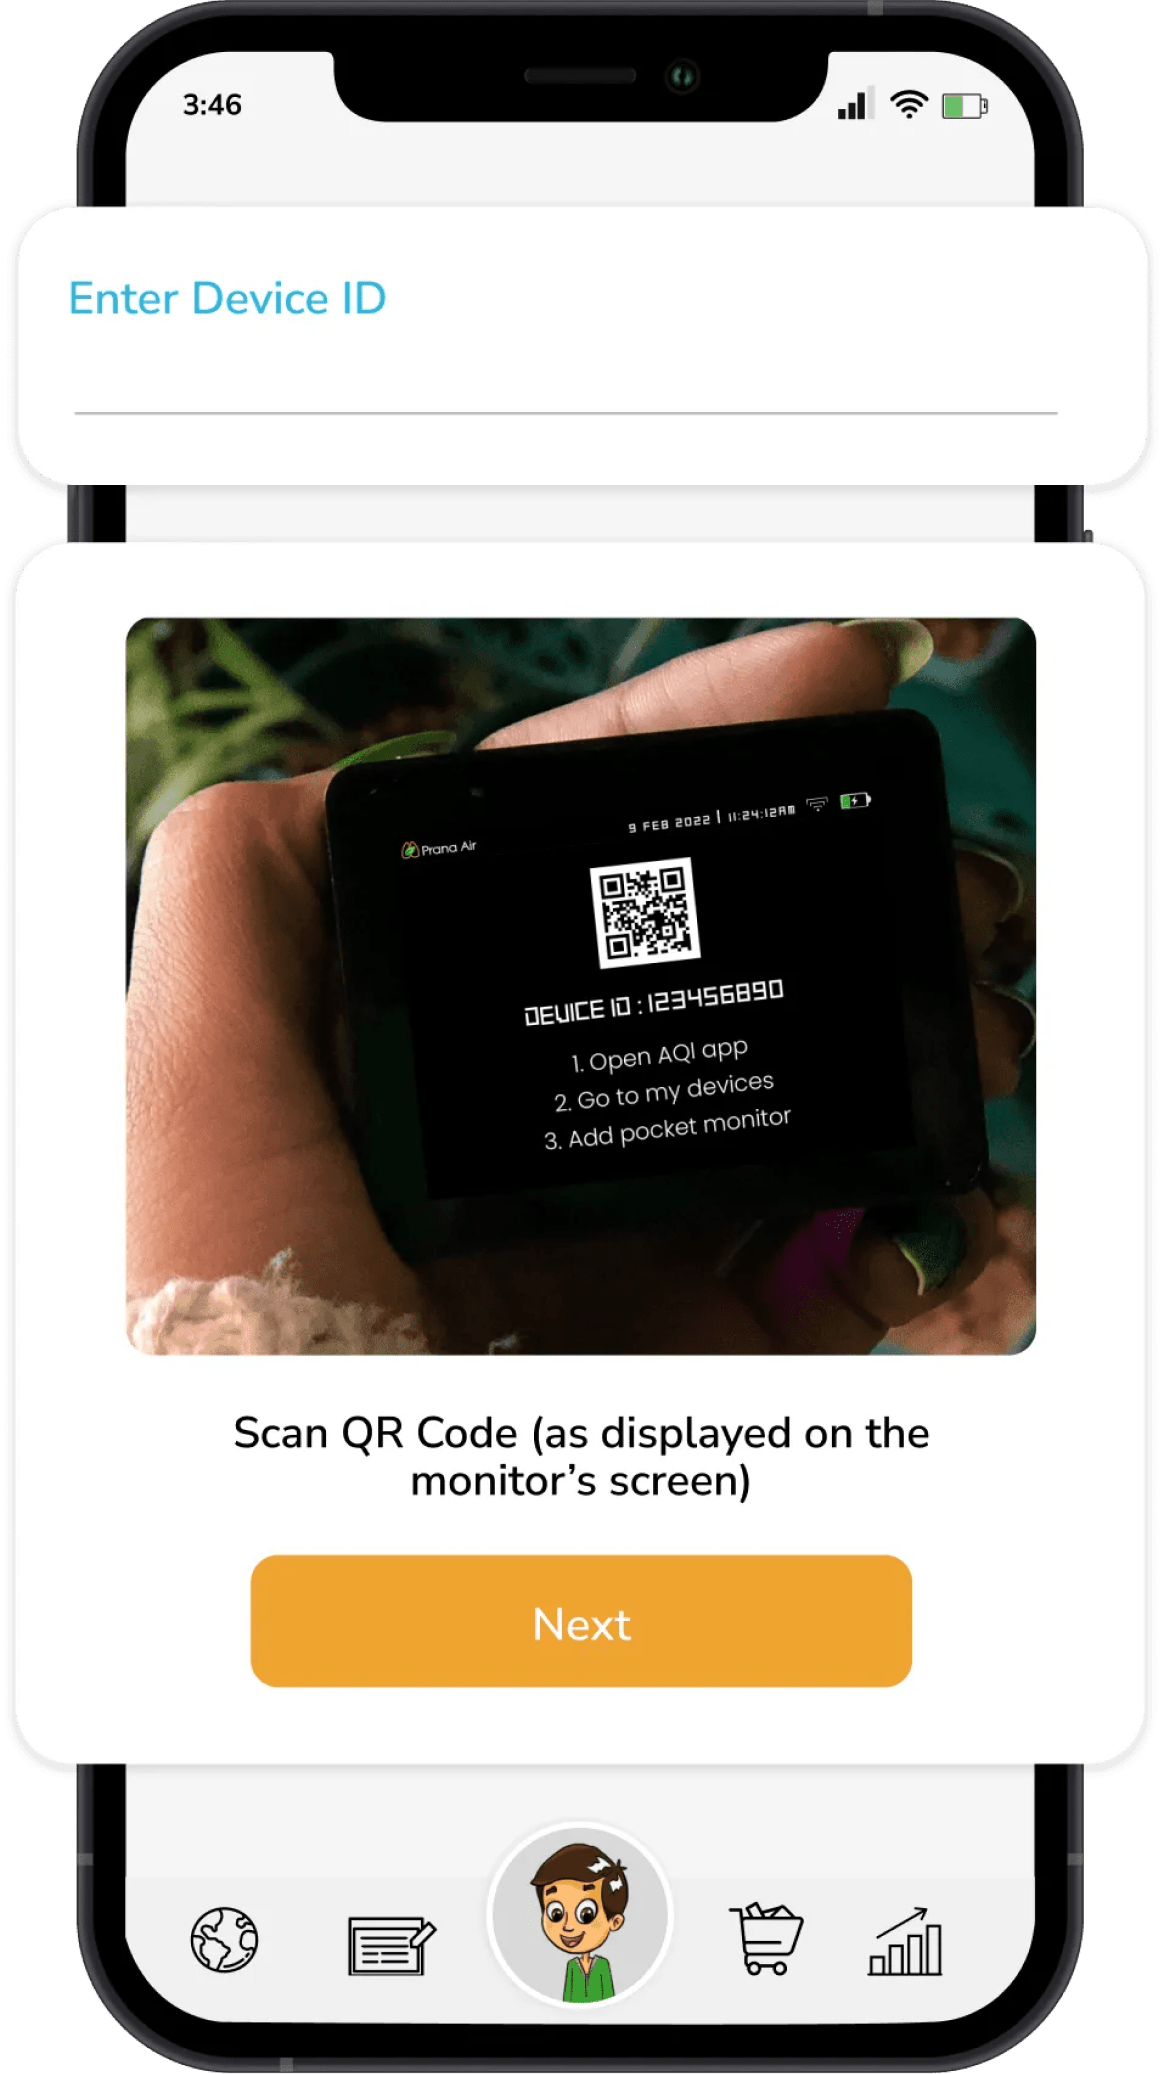
CO2 data on AQI mobile app
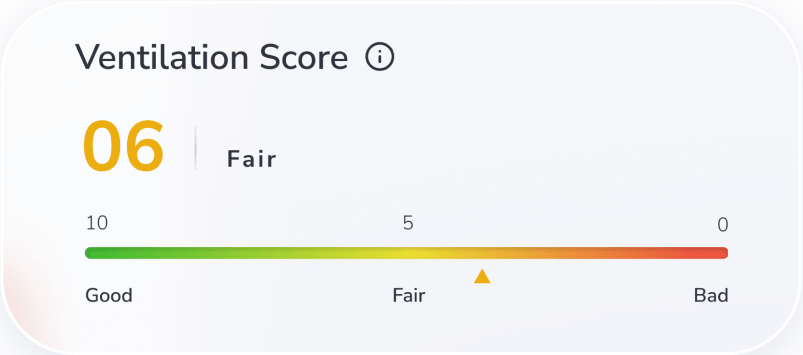
Connect your Prana Air Pocket CO2 monitor to AQI mobile app to track your CO2 levels in real time and ventilation score.
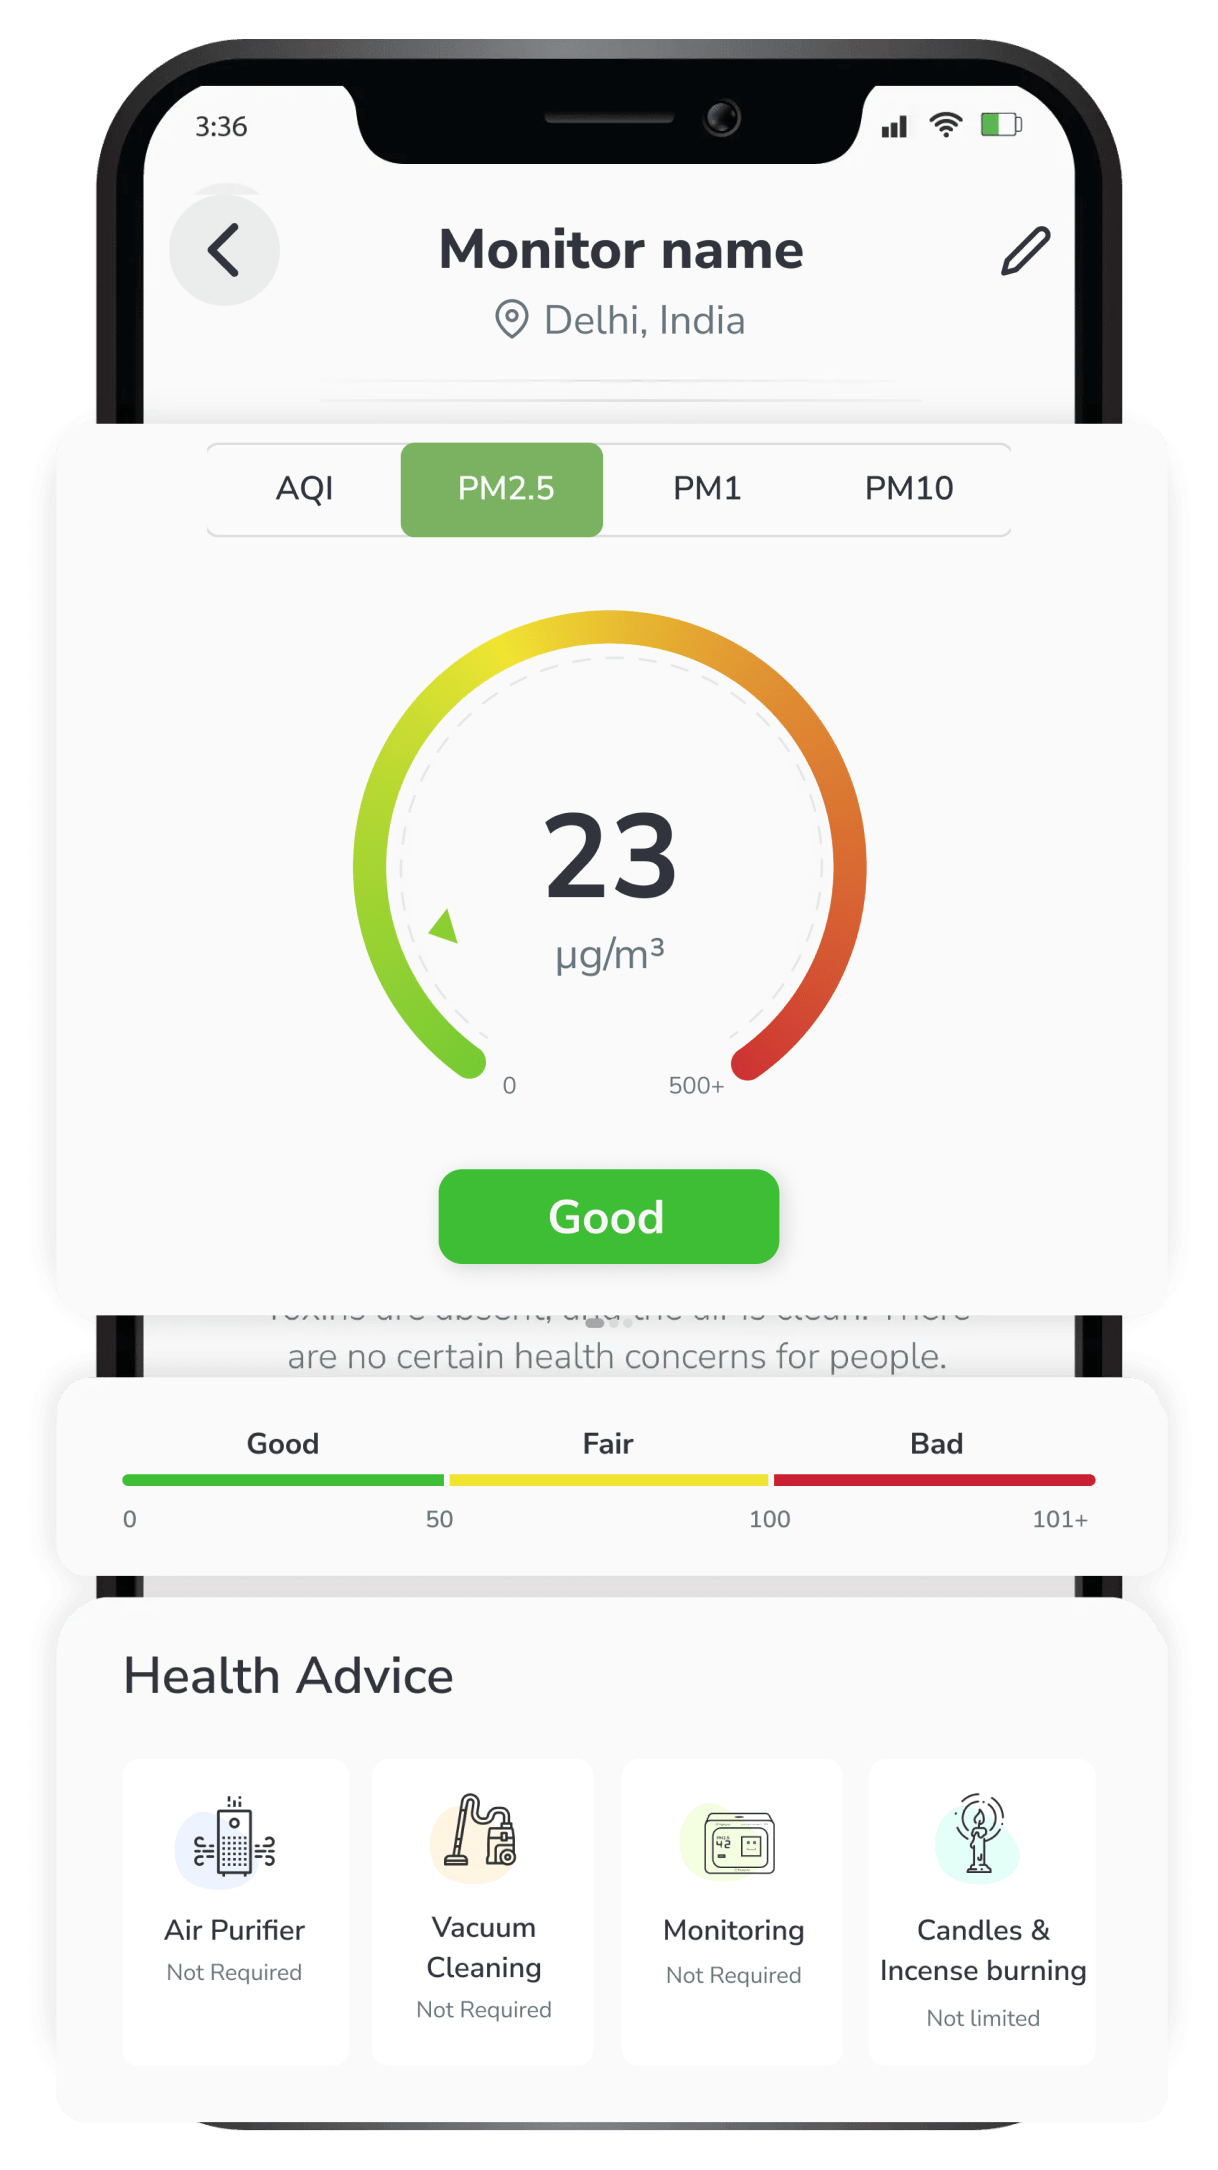
Get the health advice for indoor CO2 level from AQI app
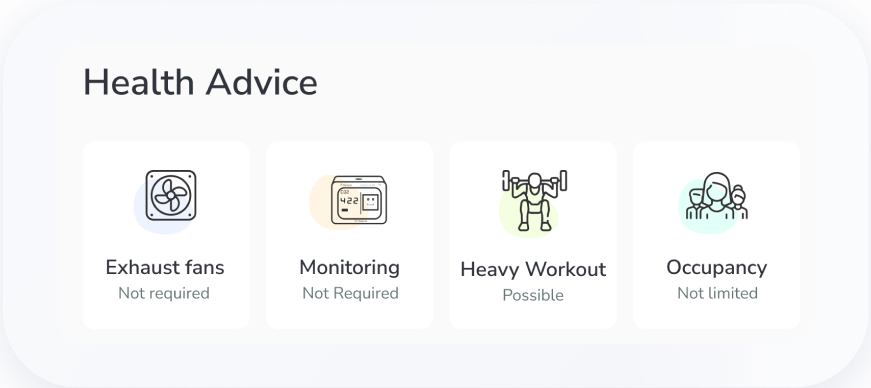
You will understand how good or bad the CO2 levels are in your house.
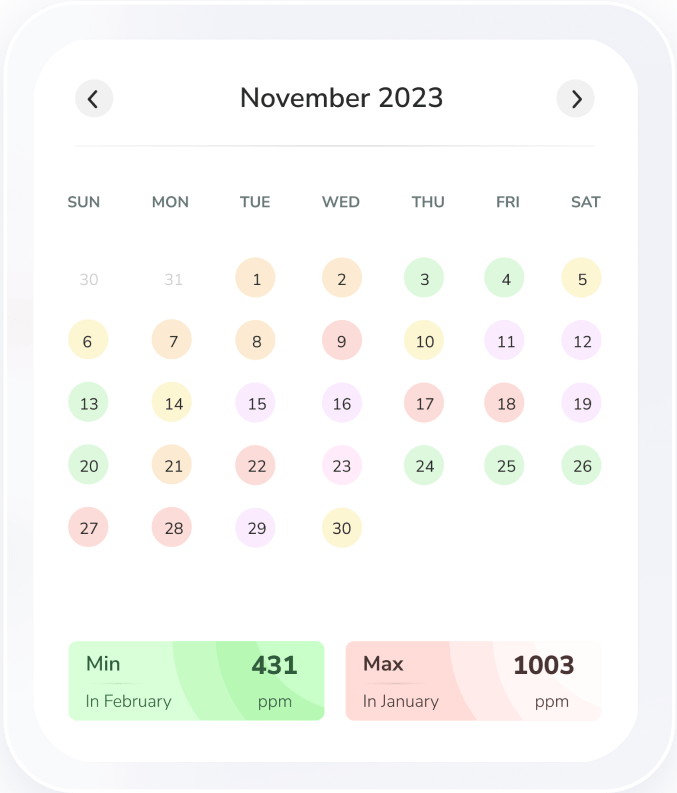
You can analyse the historic data of CO2 where you keep the monitor.
The CO2 level of a whole month can be analysed on your fingertips

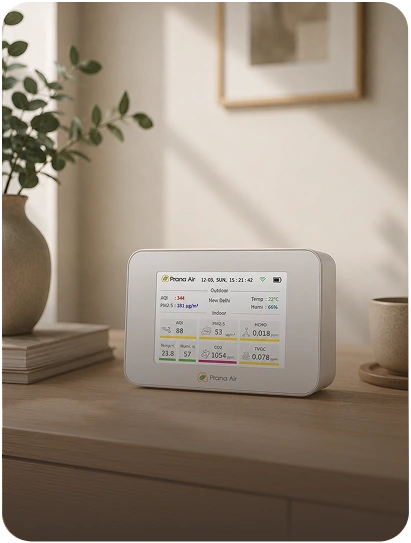
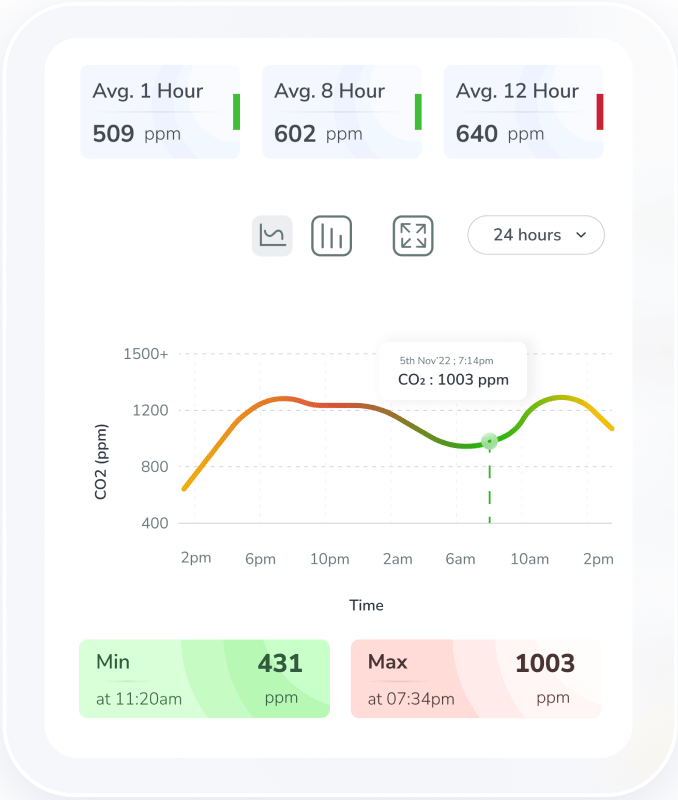
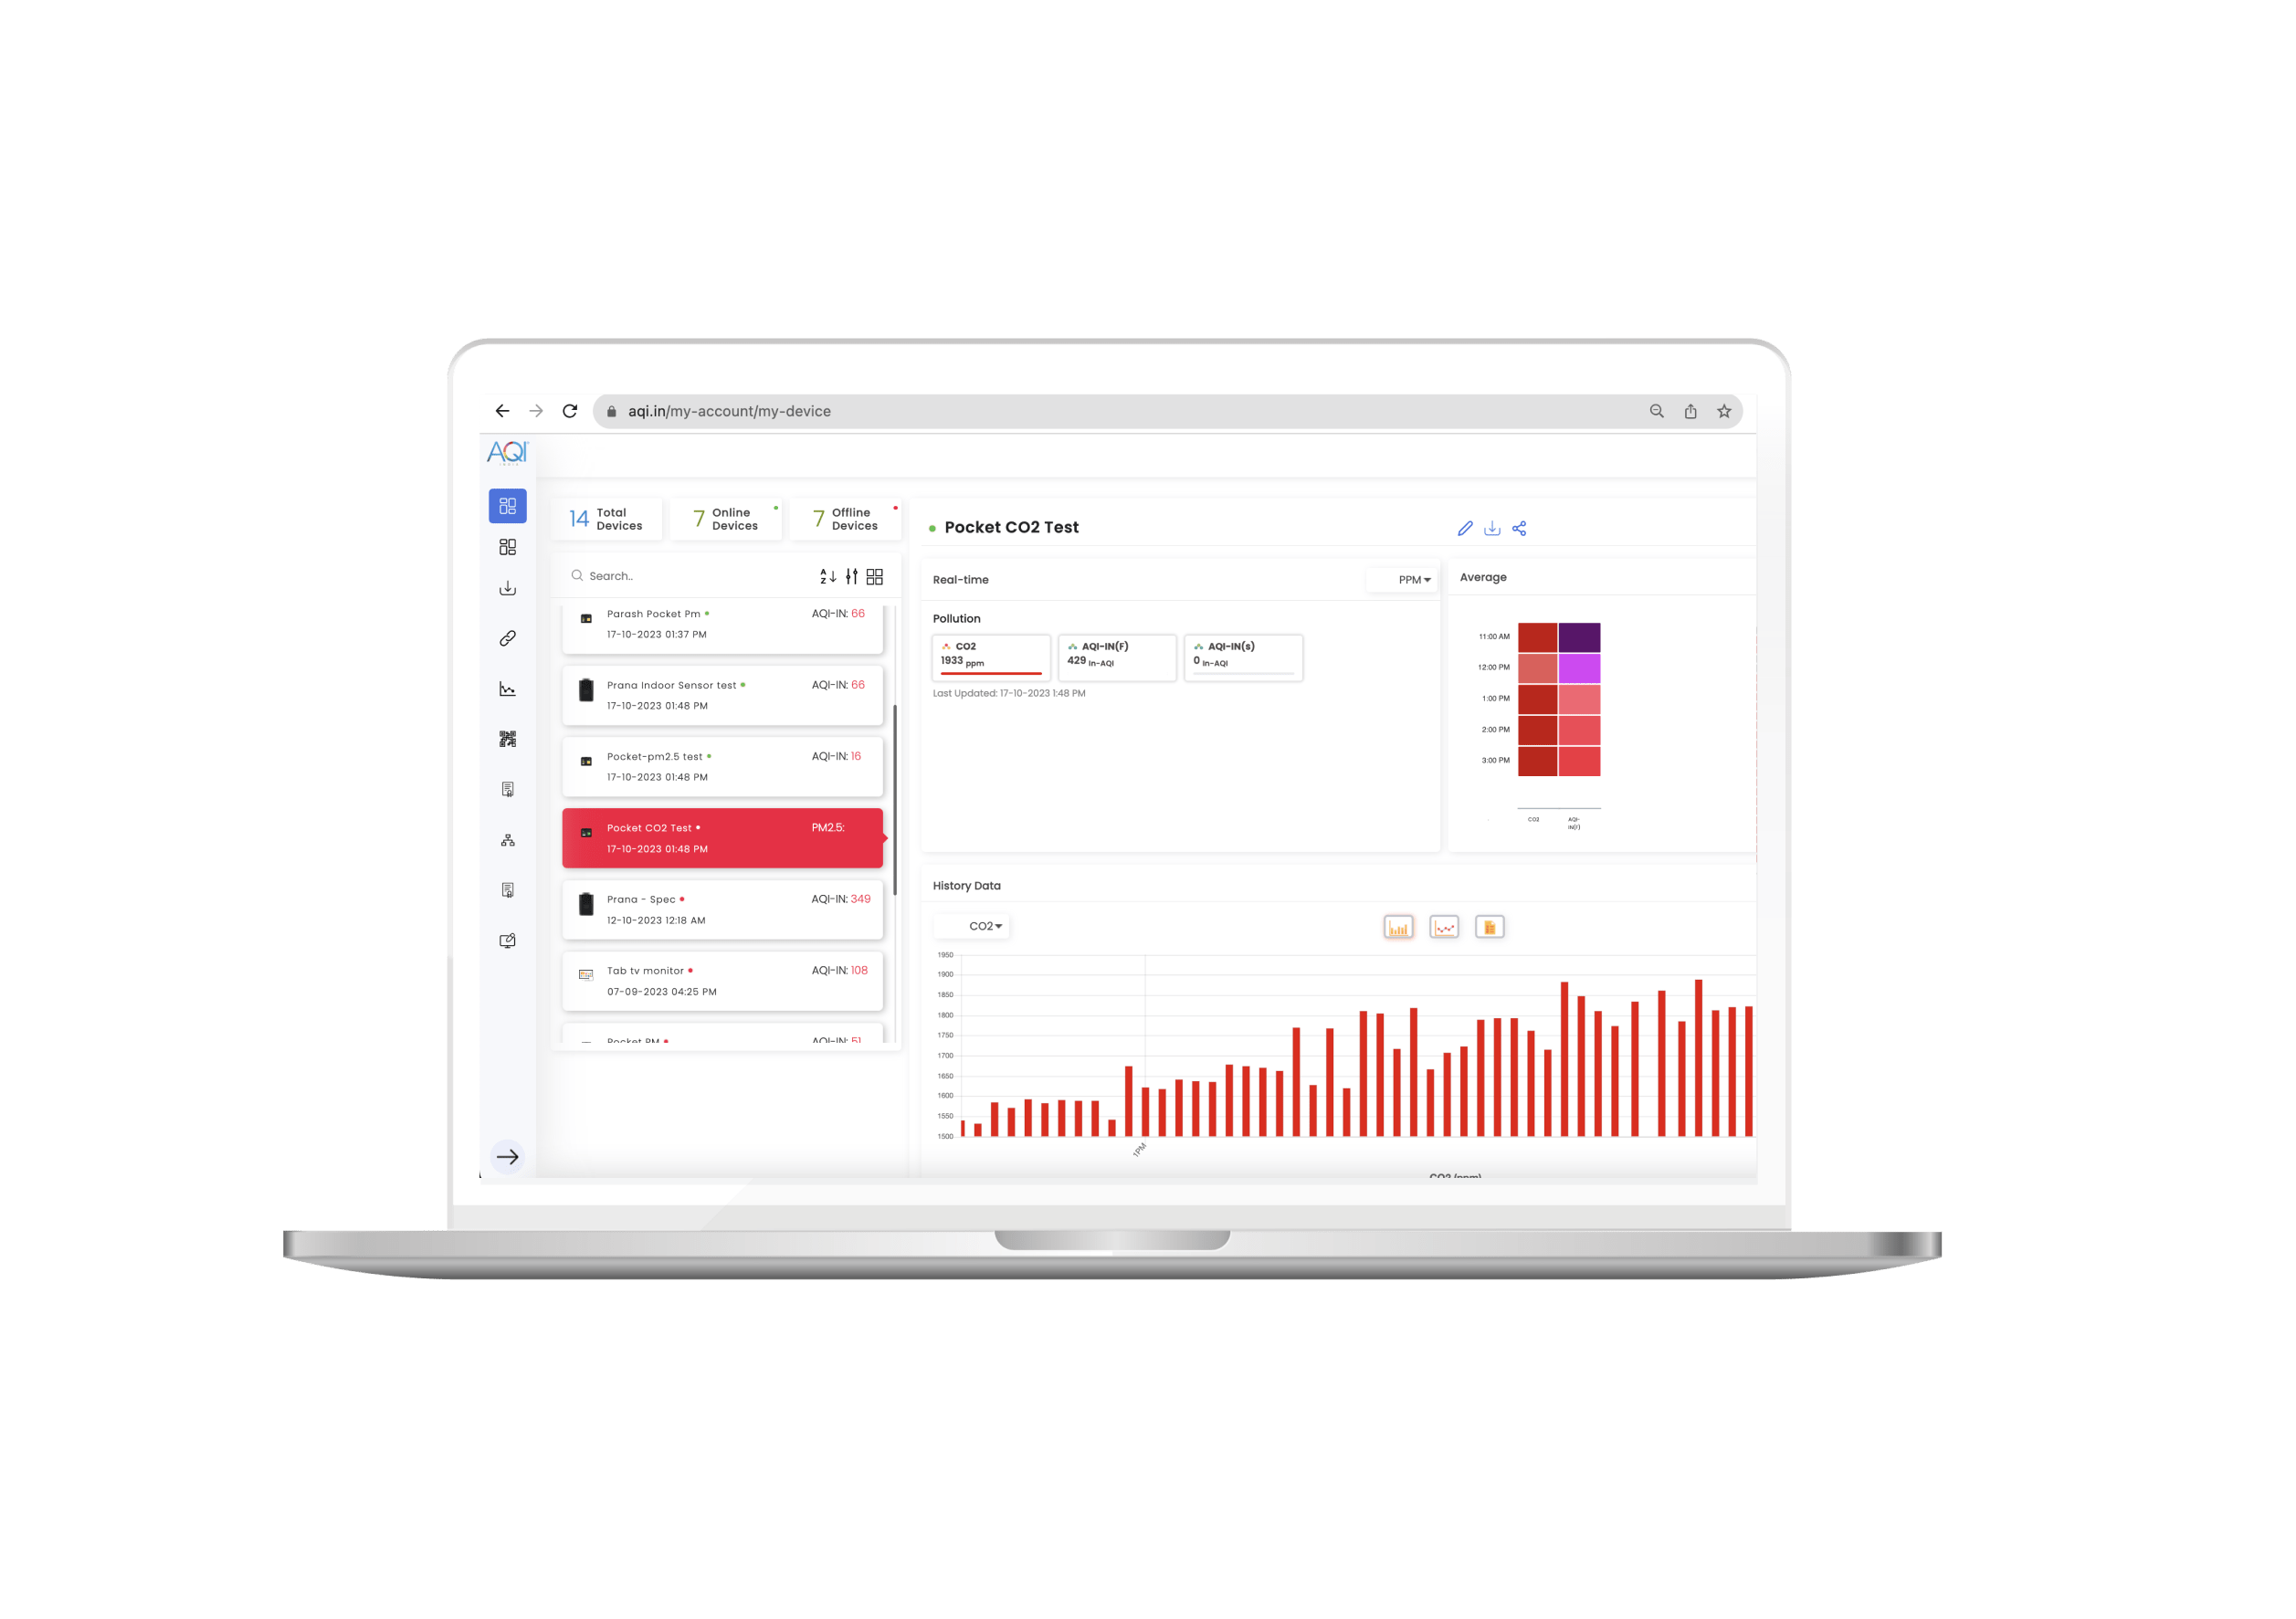
Real-time CO2 air quality data

Insightful Air quality monitoring dashboard

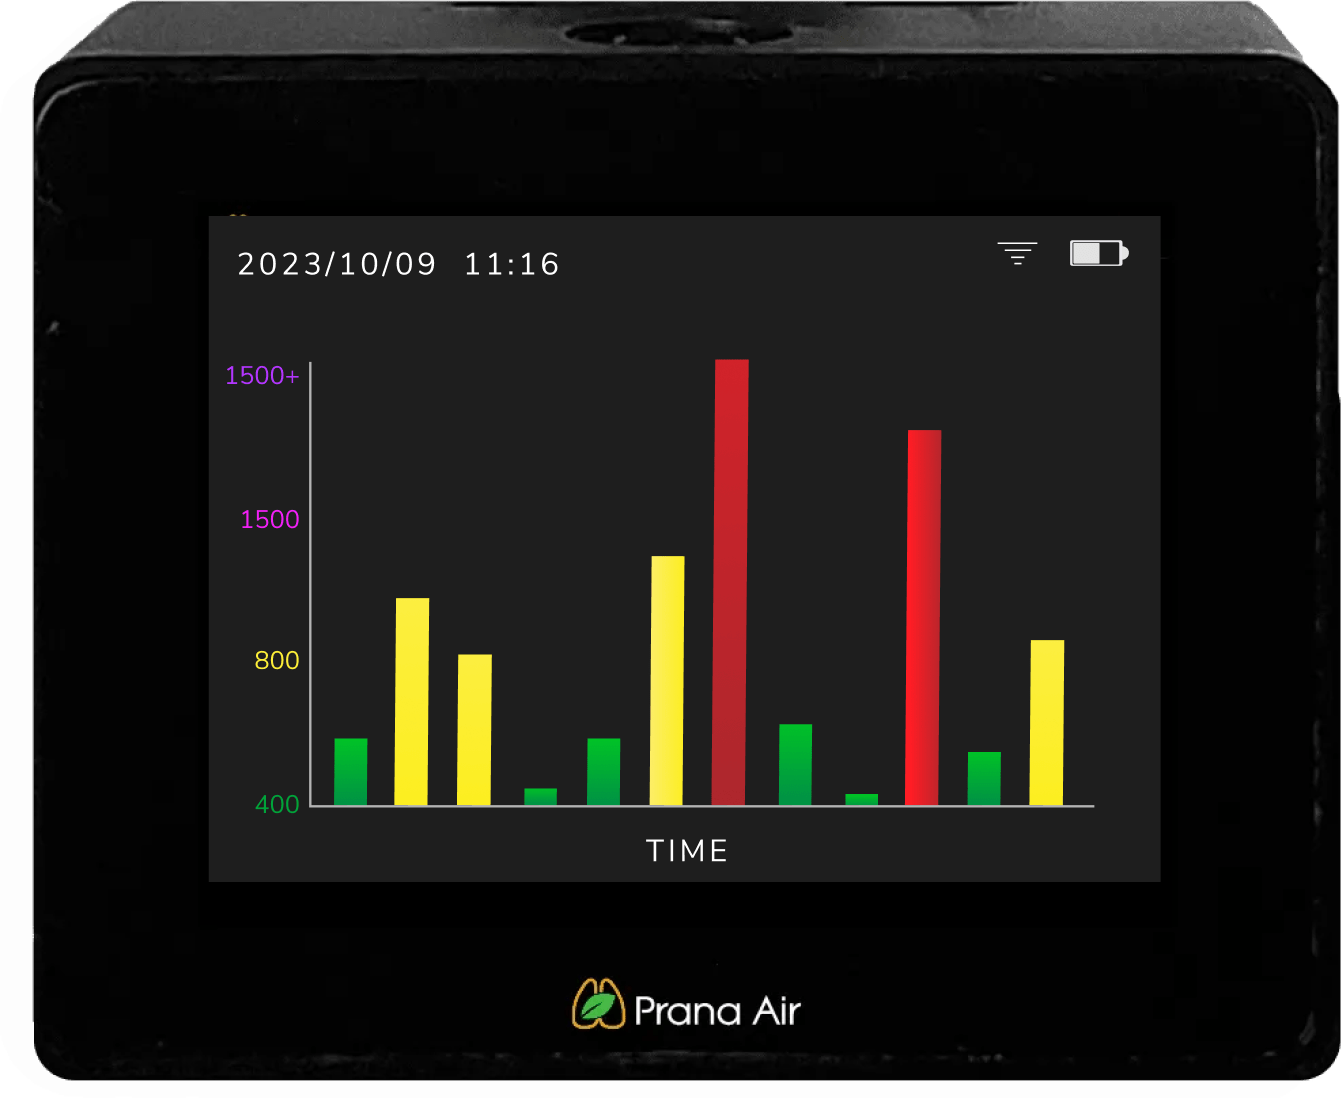
Historic air quality graphs of CO2 level

Air Quality health recommendations
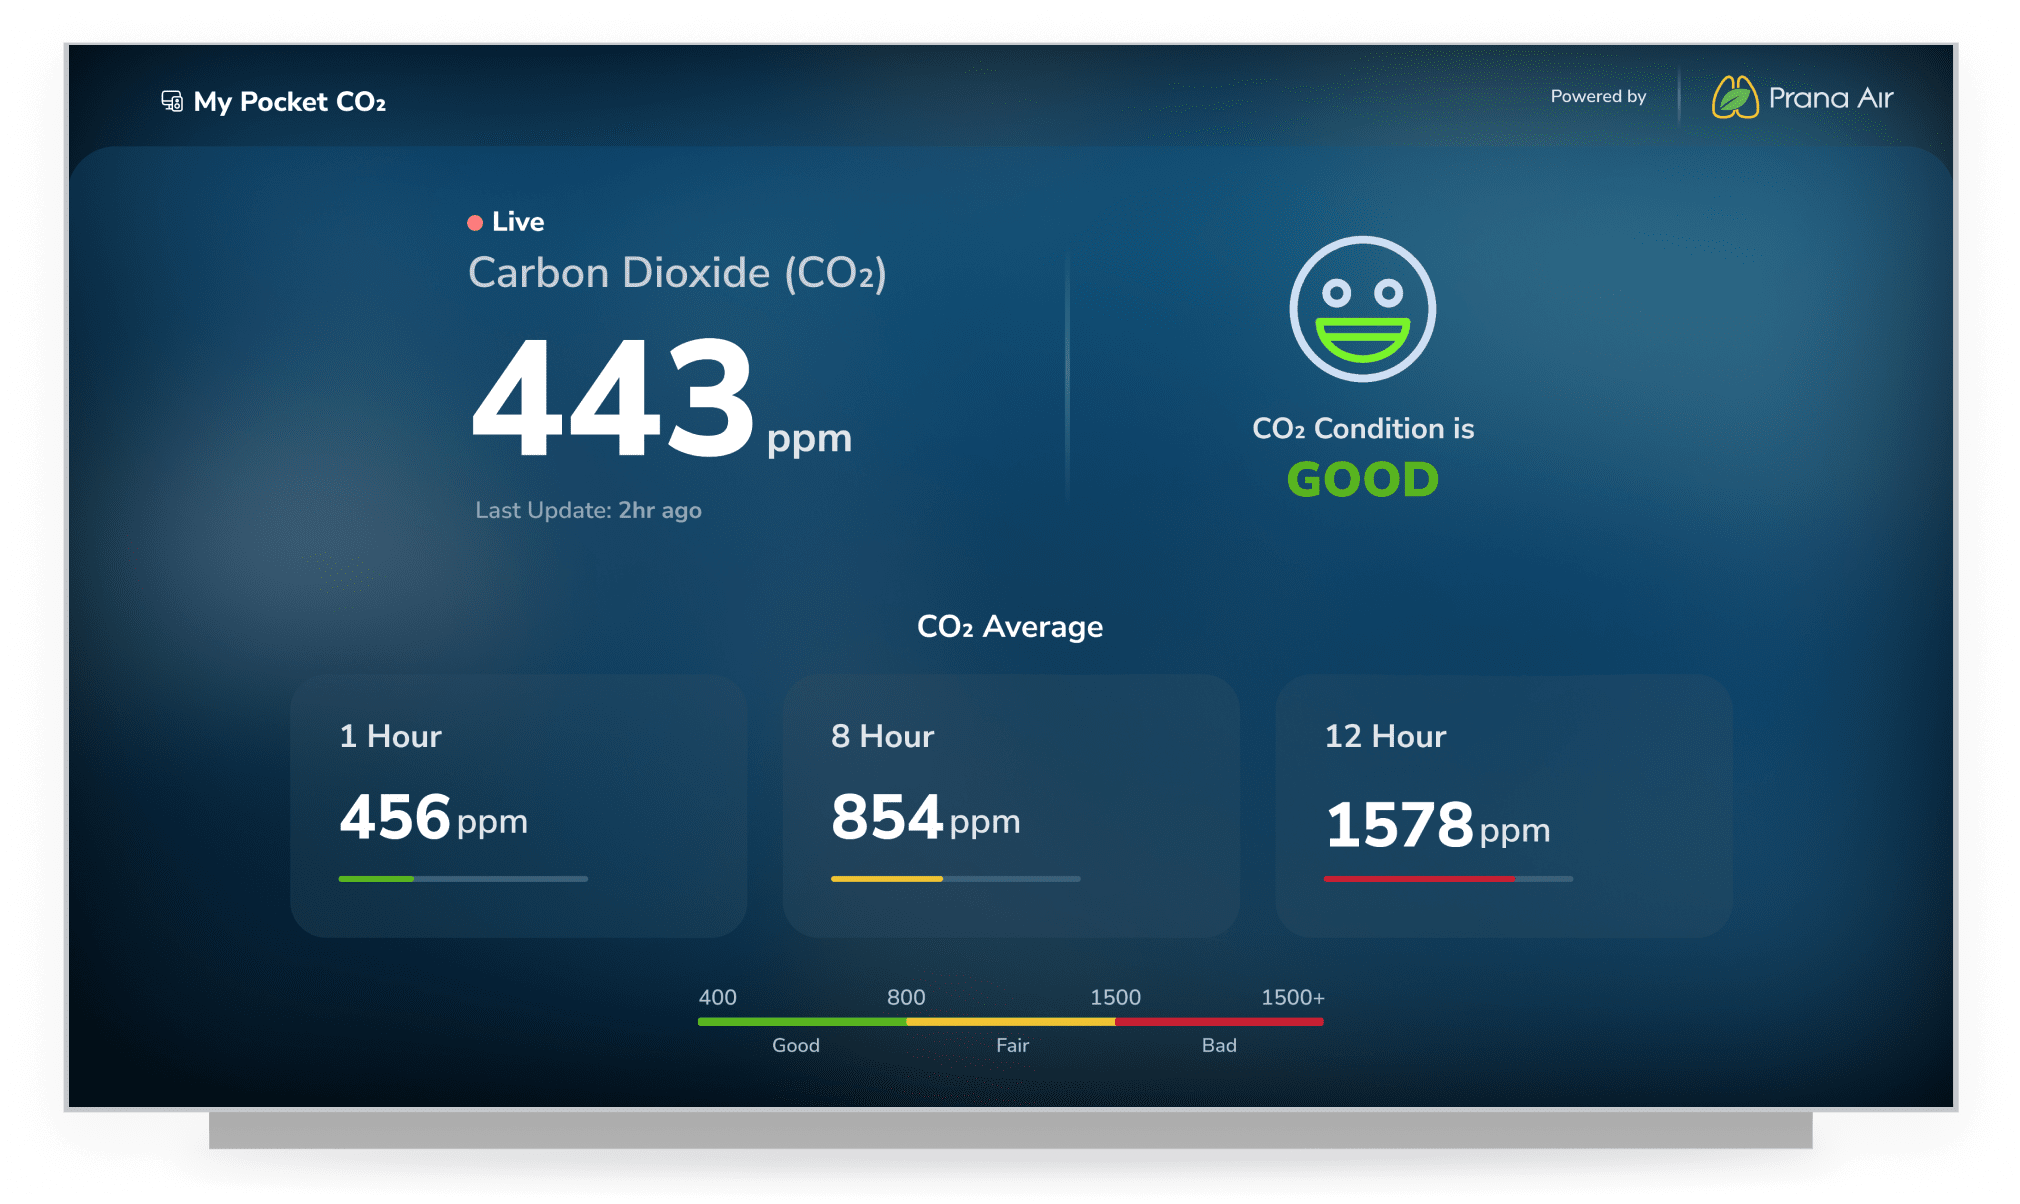
Real-time CO2 air quality data
Historic data for 1, 8, 12 hours.

Control the TV app from mobile.

The data indicates the ventilation score.
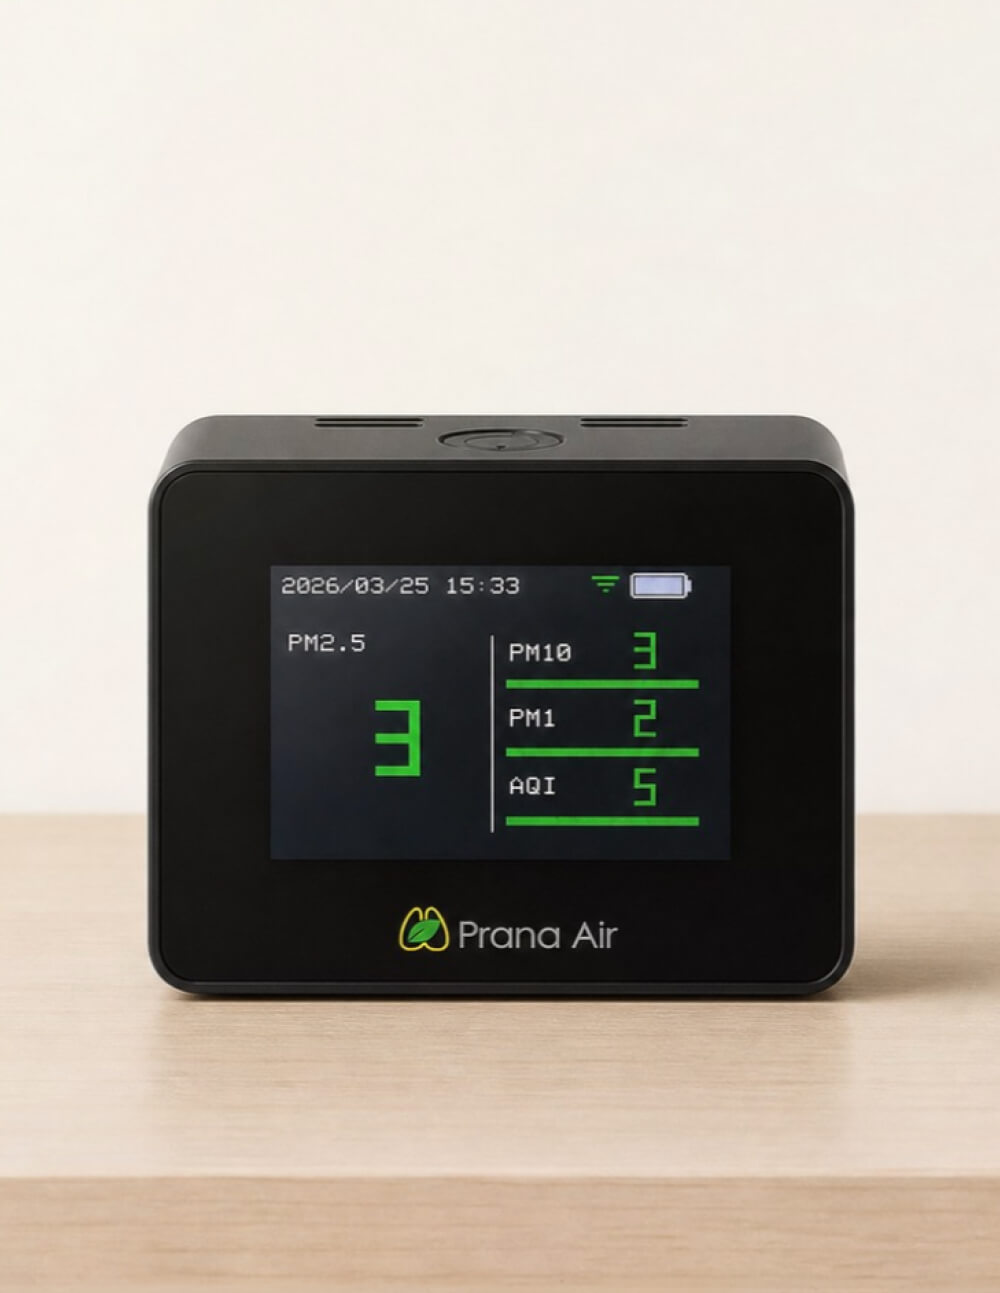
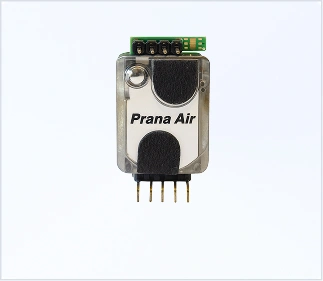
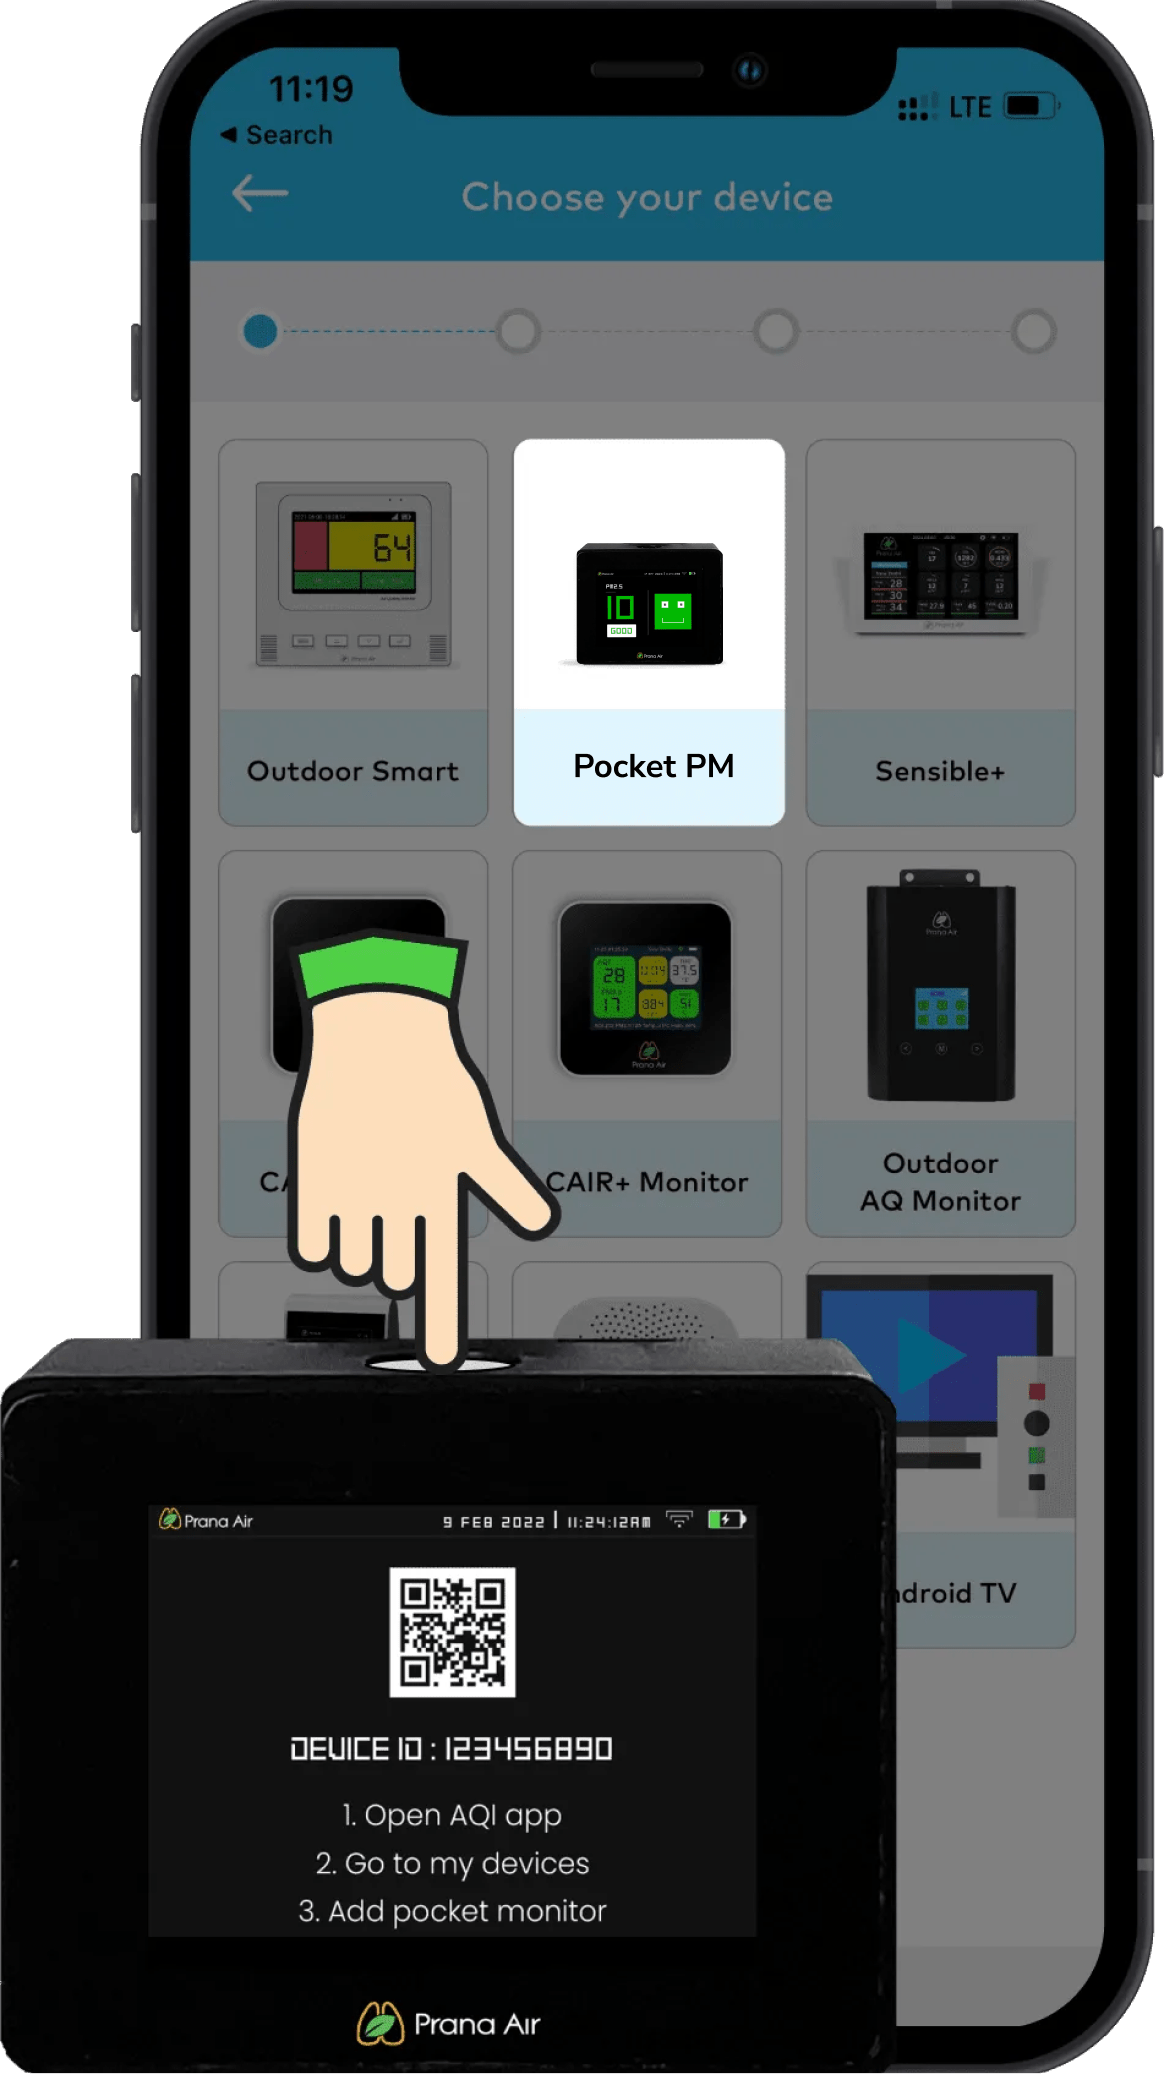
Pocket PM2.5 Monitor
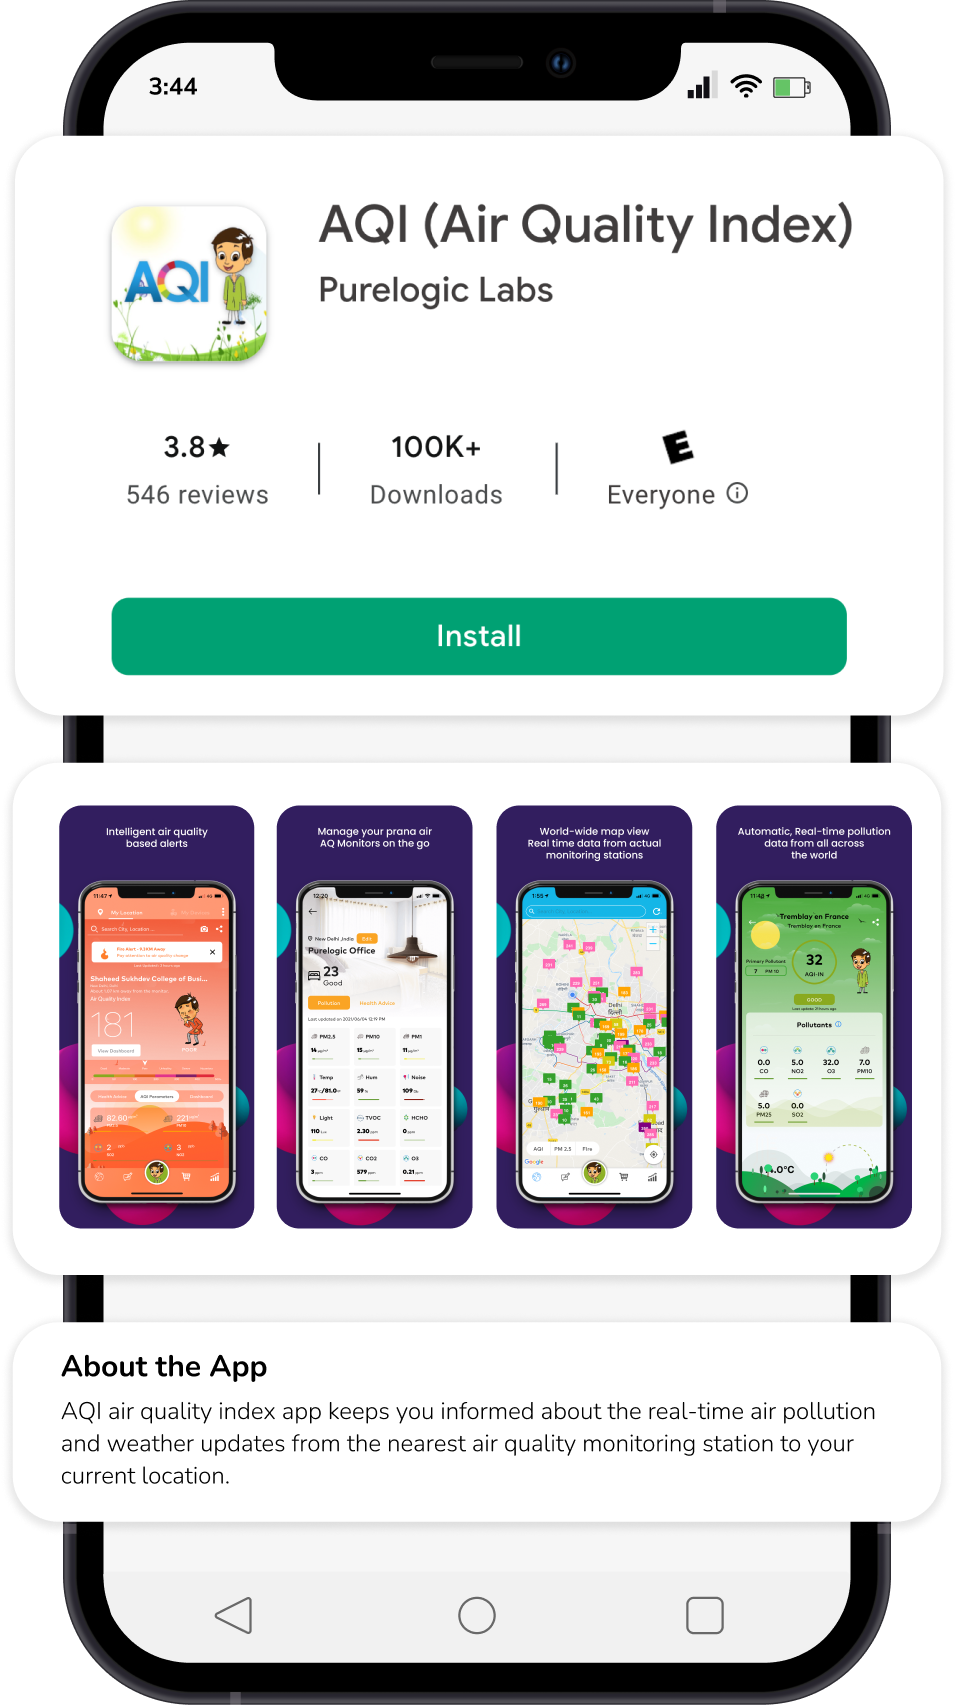
Data connectivity to Mobile App
Download the AQI App
Integrate your monitors data to our mobile application to access the data remotely and analyze the historical trend.
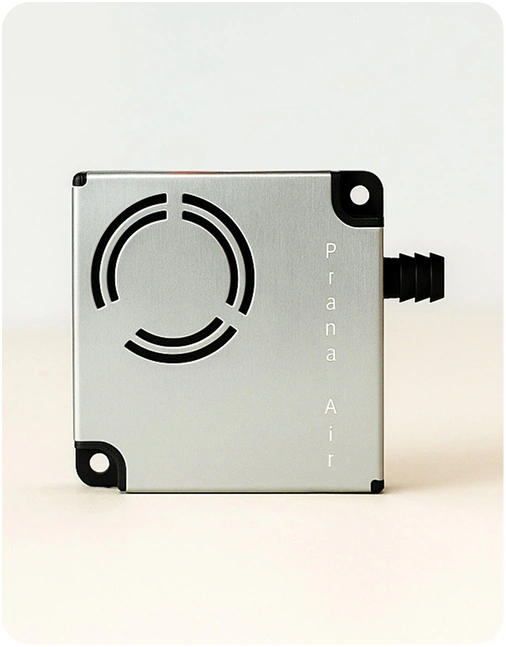
Salient FeaturesCO2 Monitor
Our monitor detects CO2 levels at ±5 % accuracy with the help of an in-built NDIR sensor. The product has a 400 mAh battery with 30 minutes (approx.) charging time. It can measure the CO2 range up to 9999 ppm.
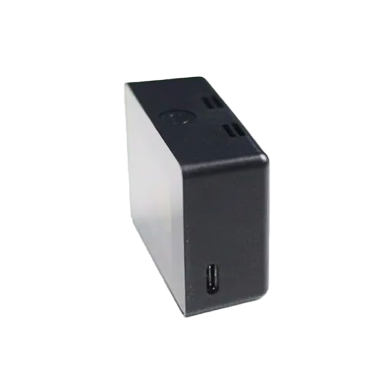
- Type-C USBCharging
- CO2 LevelReal-time Data
- 400mAhBattery
- SizePocket
- NDIRSensor
- WiFi 2.4 GHzConnectivity
Technical Specifications
CO2 Monitor
Product Name :
Pocket CO2 monitor
Sensor :
CO2 NDIR
Dimension :
5.8 x 2.5 x 4.6 cm
Power Supply :
5V DC / Type-C USB cable
Connectivity :
WiFi [2.4GHz]
Mobile App Enabled :
AQI Mobile App [iOS & Android]
Range :
Up to 9999 ppm
Operating temperature range:
-5° C - 45°C
Weight :
60 gram
Display :
LCD Display
Data Storage :
AQI Cloud Storage (option)
Battery :
400 mAh rechargeable battery
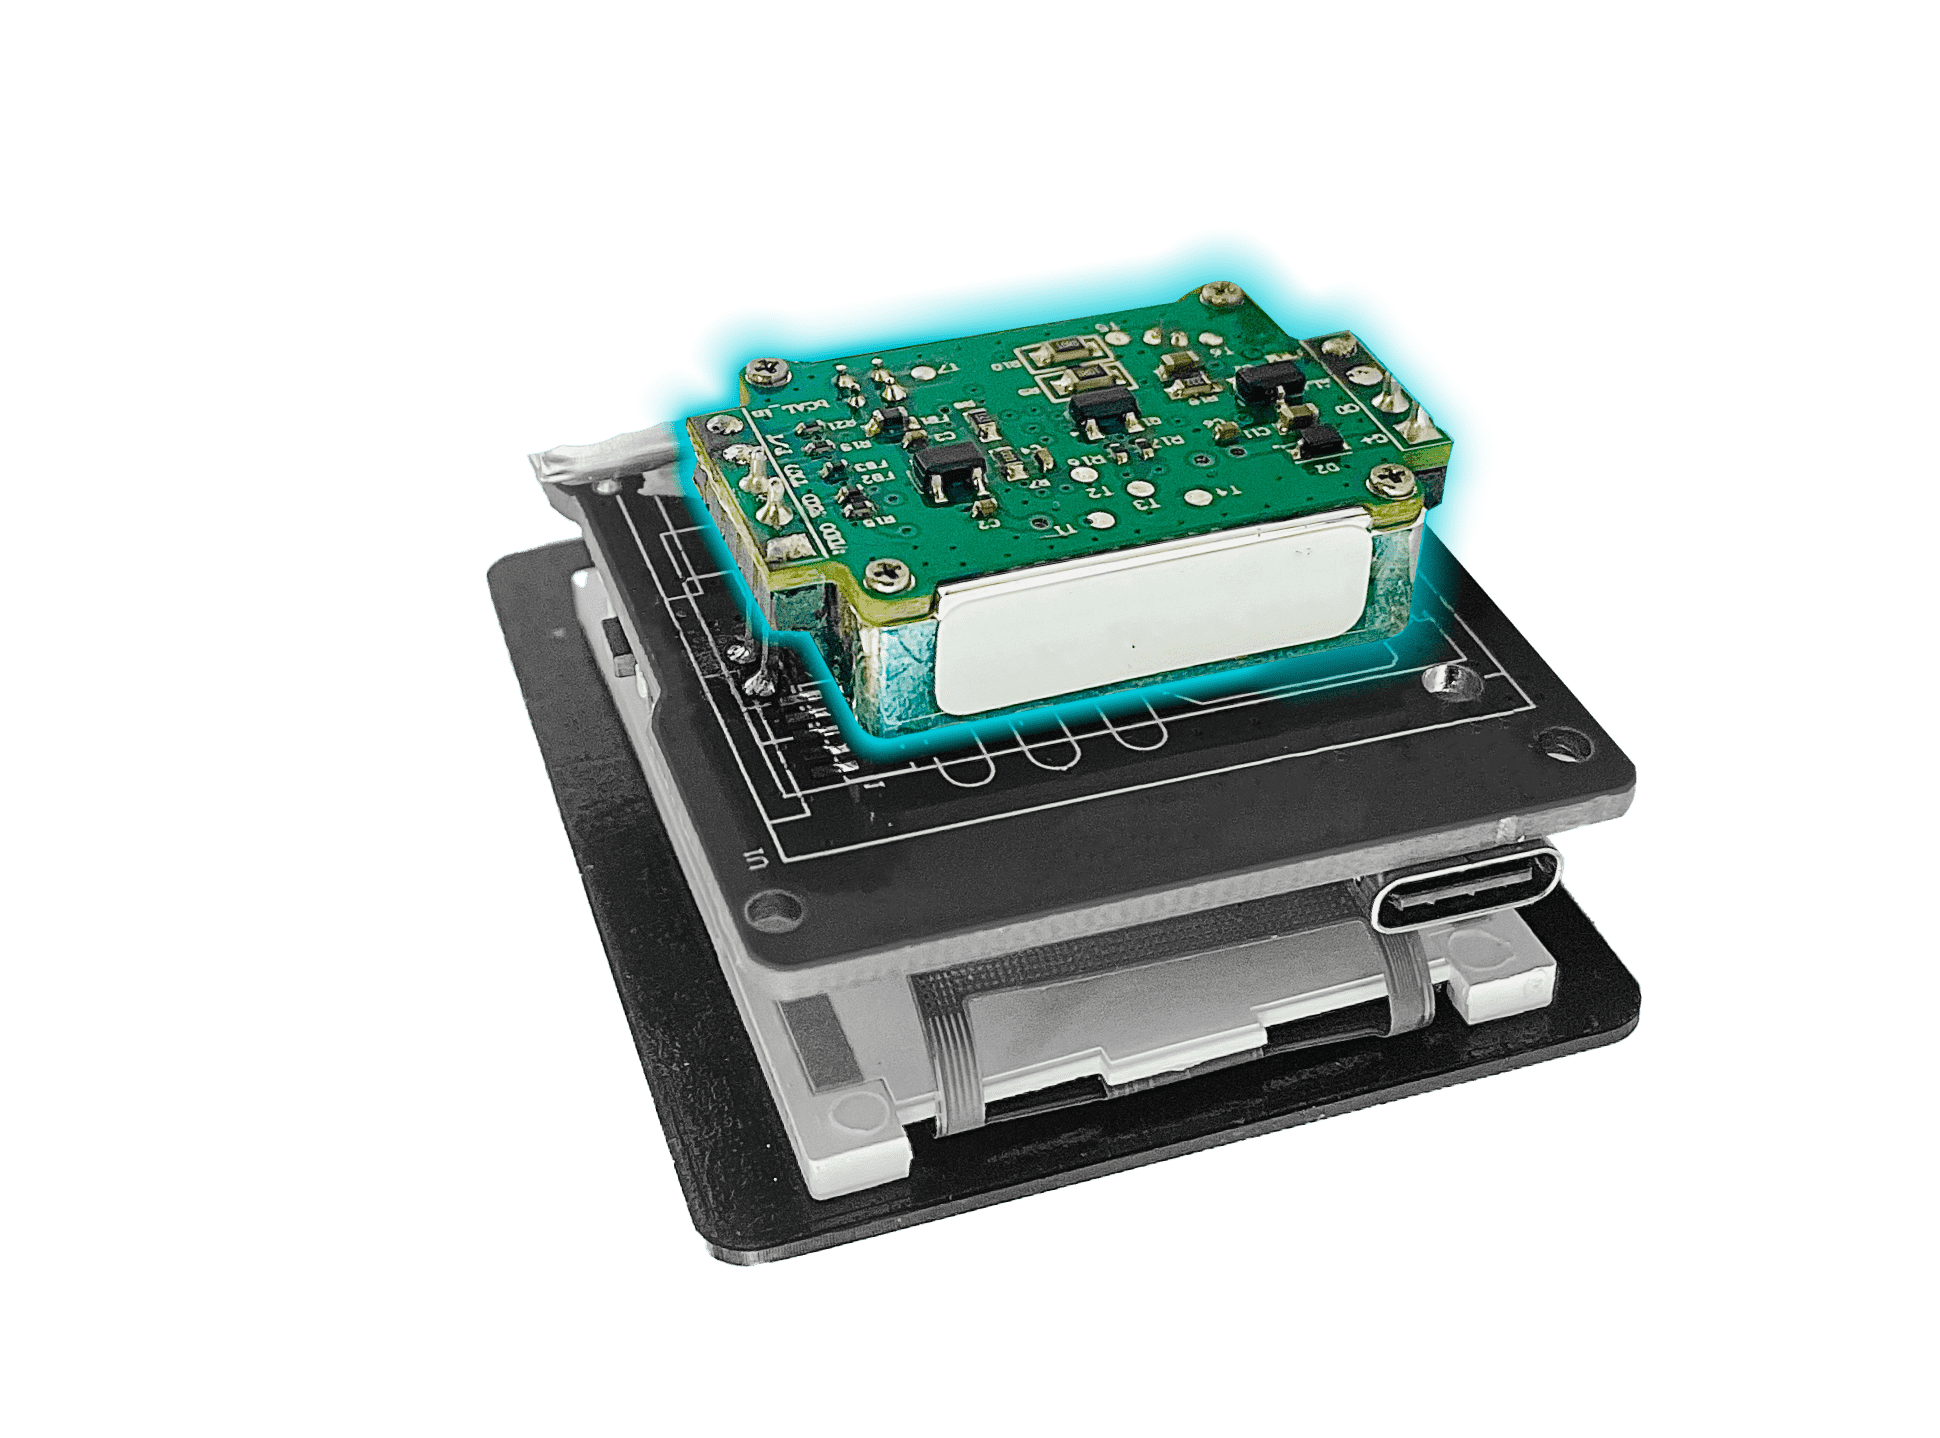
NDIR Technology
for more Accurate Detection
With Prana Airs CO2 sensor is based on the non-dispersive infrared (NDIR) principle, which is the most widely used and trusted technology for CO2 sensing.
Find OutCO2 Health Index
The CO2 health index will help you understand the quality of the air you breathe and the health impacts. You will also know if your house or office ventilation system is good or bad.- Good350-700
 The air is fresh and free from toxins. People are not exposed to any health risk.
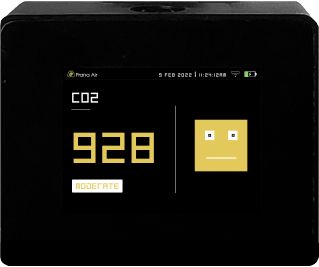
 - Moderate701-900
 Indoor CO2 levels with a good ventilation rate
 - Poor901-1200
 Tiredness, laziness, and stuffiness in the air
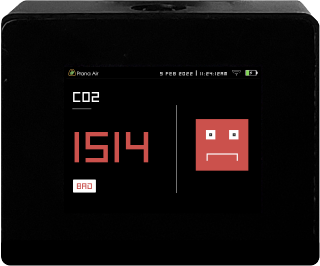
 - Unhealthy1201-1500
 Lack of concentration, sleepiness, drowsiness, headaches, increased heart rate, stuffiness in the air, nausea, etc. can be experienced.
 - Severe1501-2500
 Many countries have occupational exposure (like an eight-hour TWA).
 - Hazardous2500+
 Such high levels of exposure can cause acute oxygen shortage, unconsciousness, severe neurological damage, and even death.
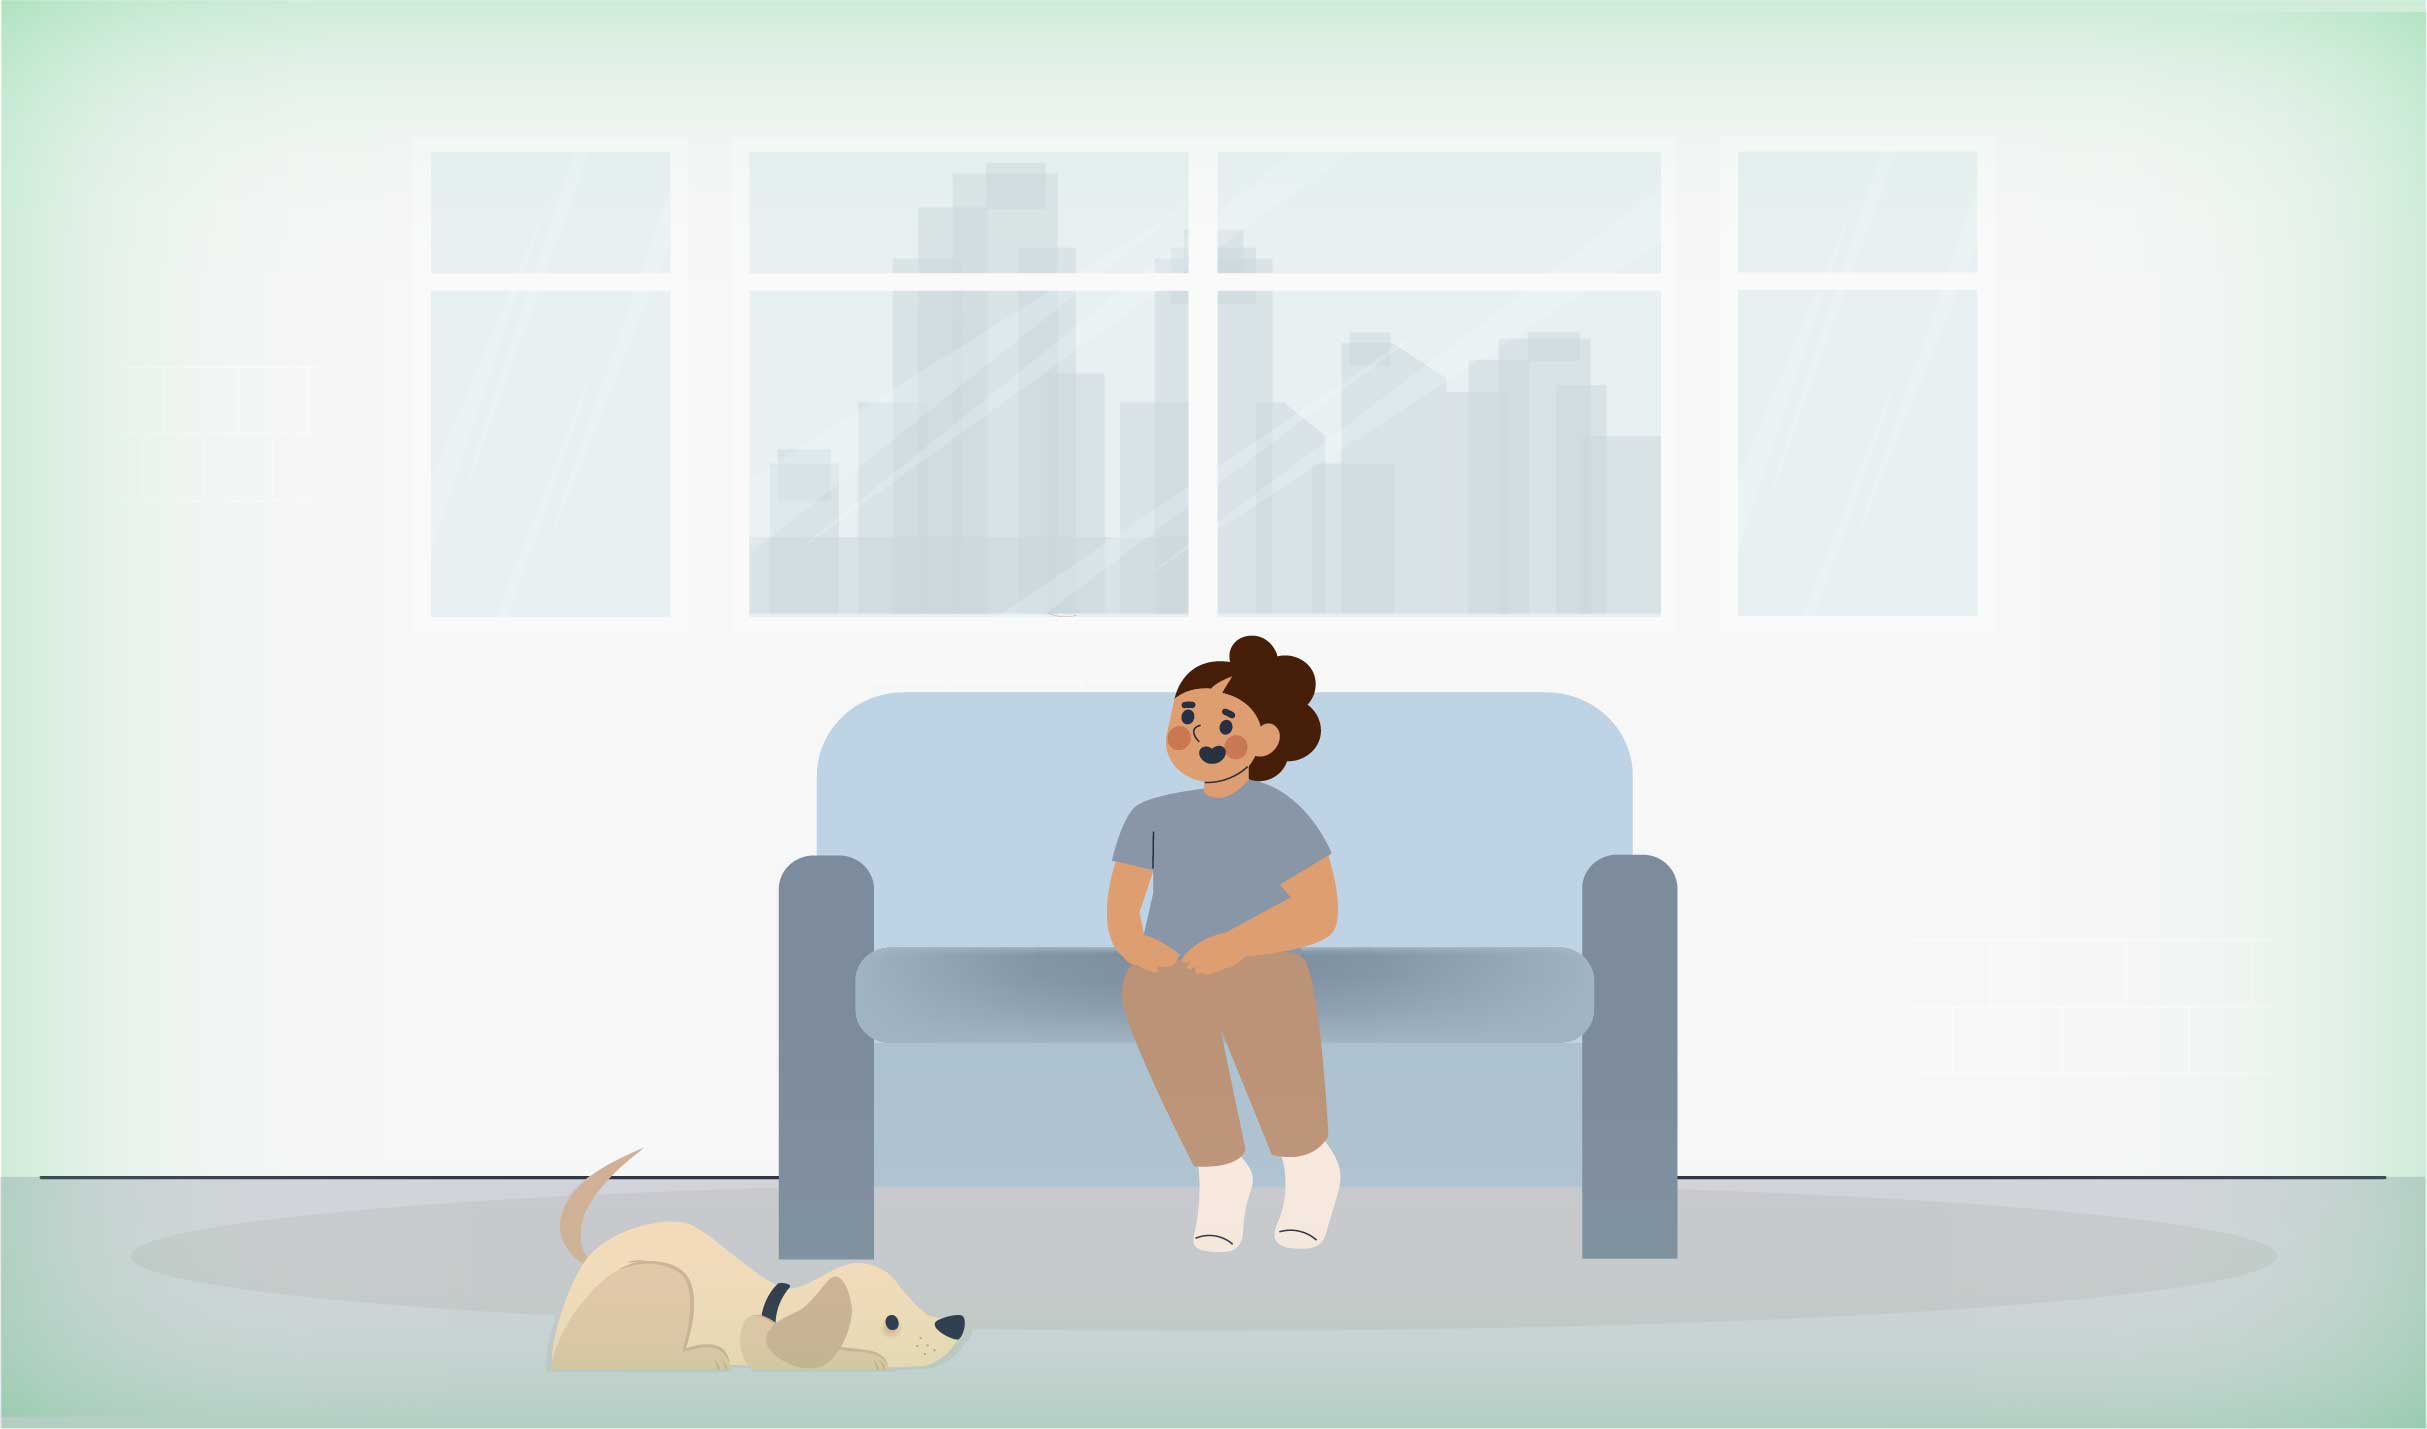
Applications of CO2 Monitor
Based on the dense CO2 concentrations that can be present indoors, Prana Air Pocket CO2 monitor can have various indoor applications like home, school, office, etc. The below cases are on a condition when any fresh air machine or proper ventilation system is not facilitated.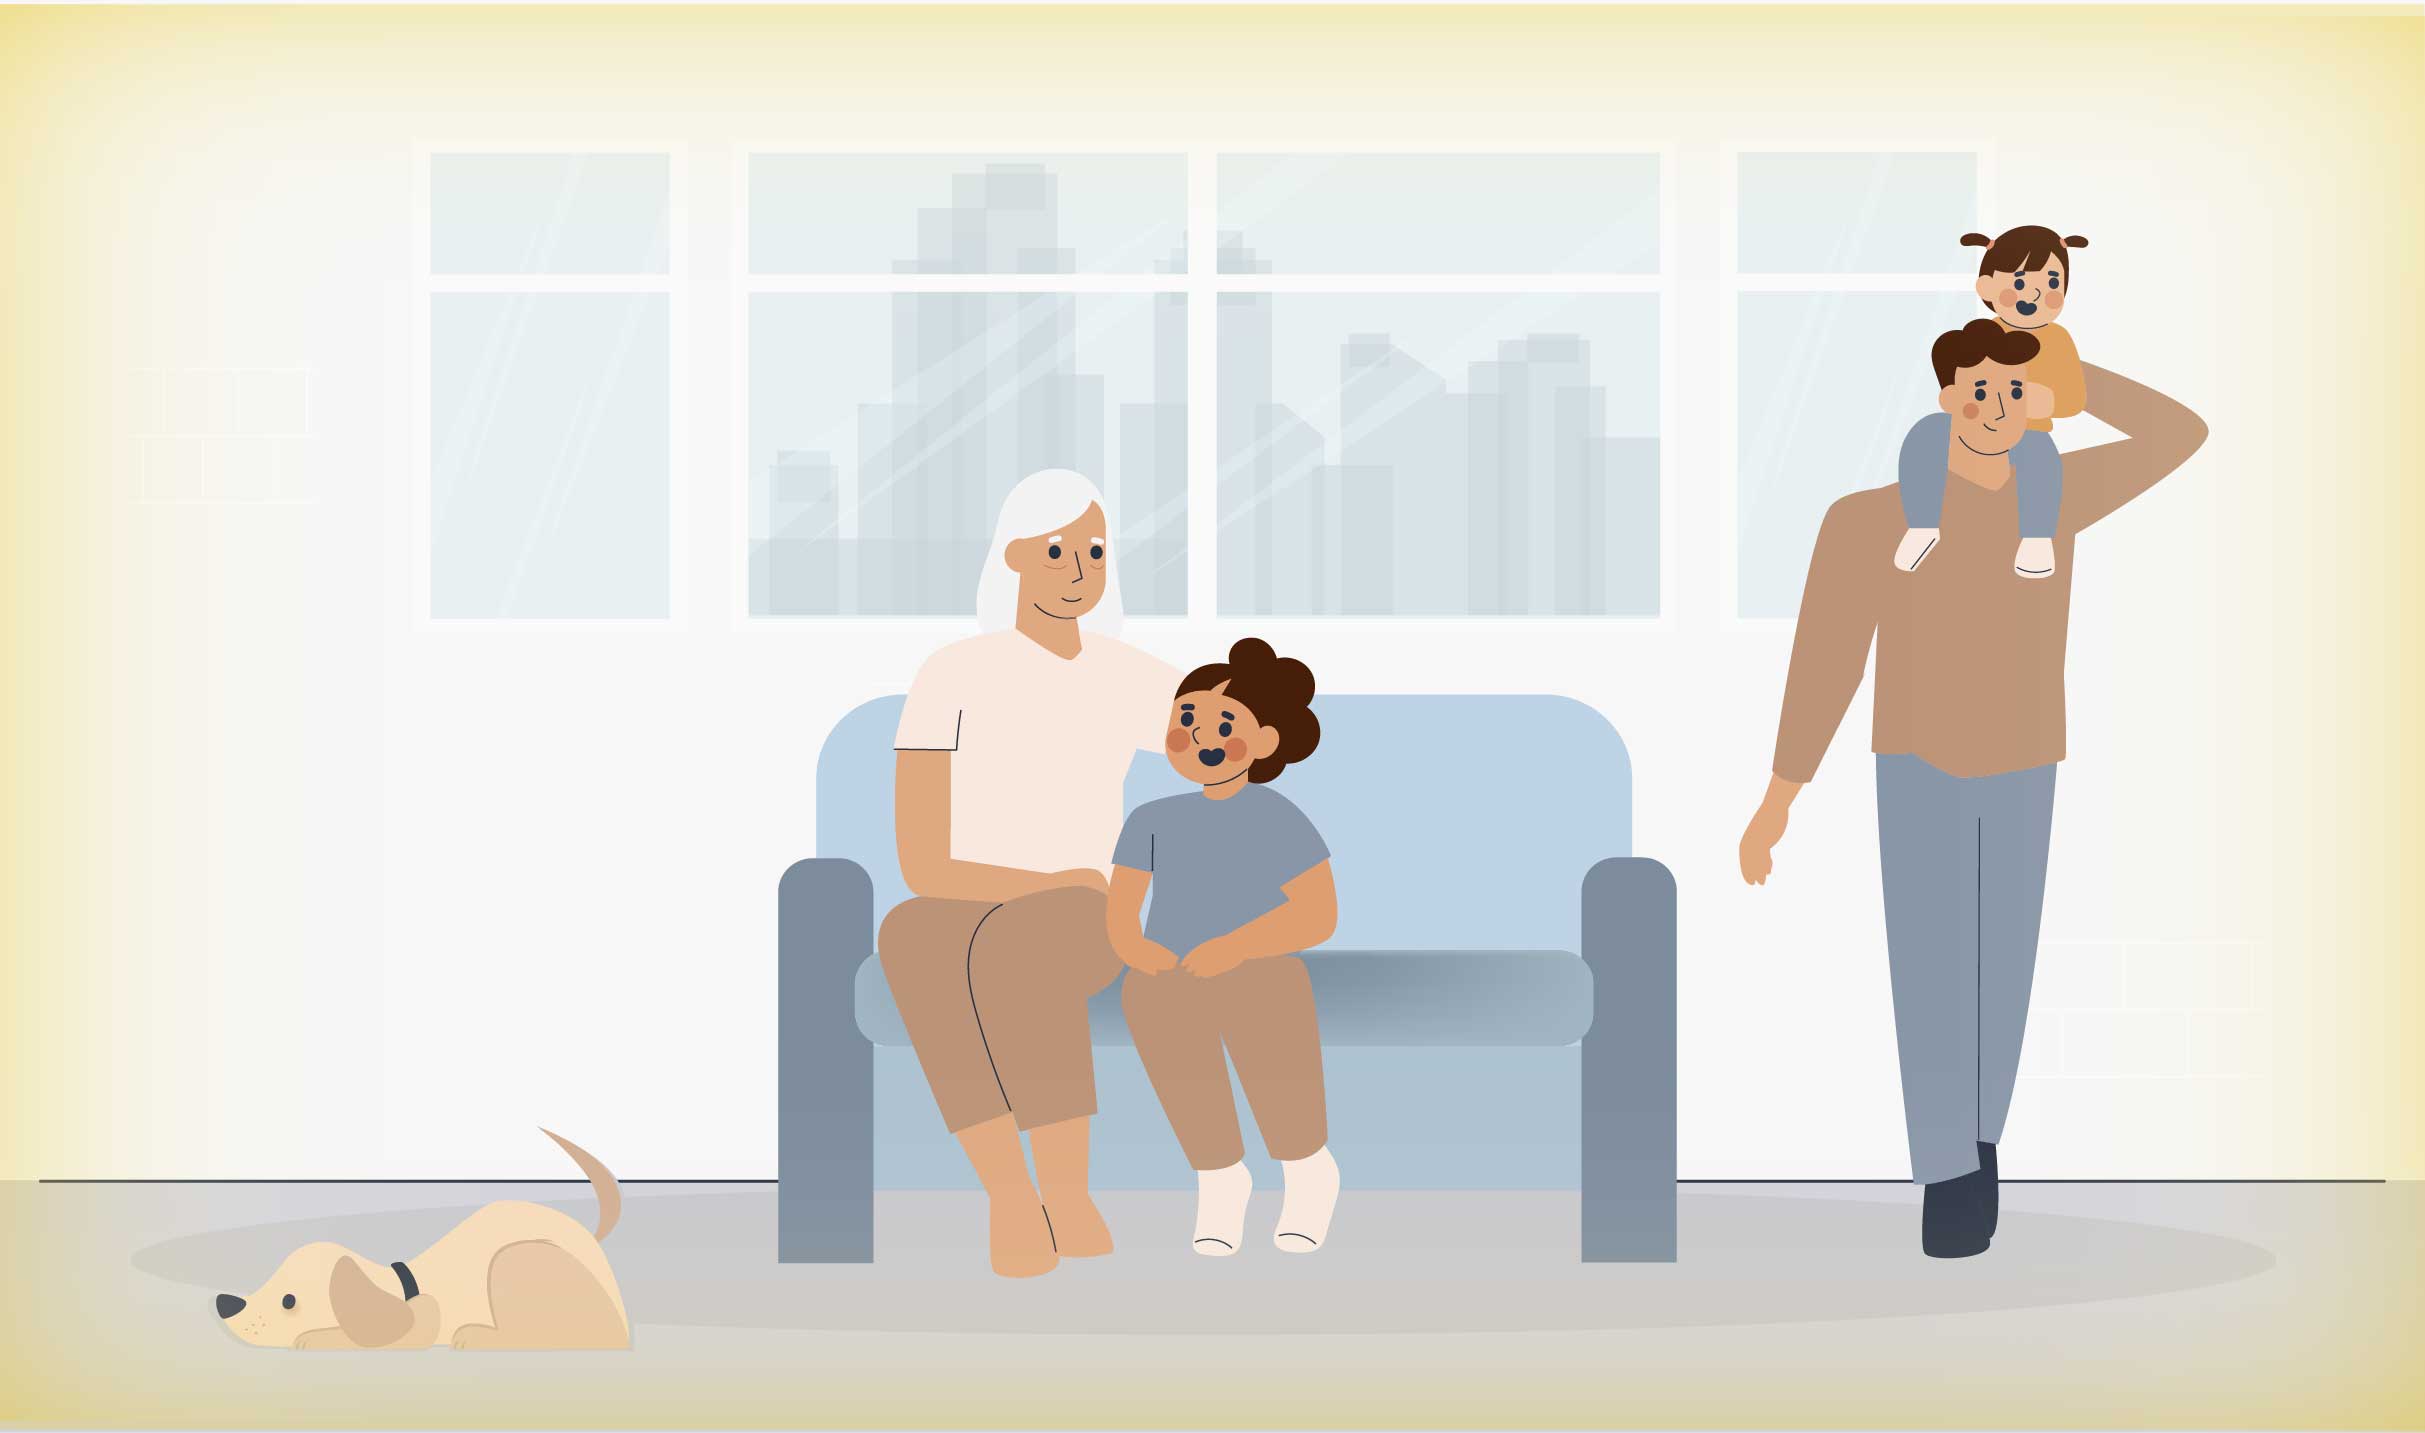
01
Moderate CO2 At Home – Morning
Usually, at the beginning of the day, the CO₂ levels will range from good to moderate in the early morning.
![]() CO₂ Range: Between 400-1000 ppm
CO₂ Range: Between 400-1000 ppm
![]() Time Frame: Till 10 am
Time Frame: Till 10 am
![]() Health Impacts: Headaches, vomiting, & drowsiness.
Health Impacts: Headaches, vomiting, & drowsiness.
02
Good CO2 At Home – Morning
When there is proper ventilation and the number of people inside a house is minimal, CO2 levels remain under the good category.
Levels 250 ppm : CO2 Range ![]()
10 am – 5 pm : Time Frame ![]()
Safe to breathe : Health Impacts ![]()

03
Bad CO2 At Home – Evening
Usually, at the beginning of the day, the CO₂ levels will range from good to moderate in the early morning.
![]() CO₂ Range: Between 400-1000 ppm
CO₂ Range: Between 400-1000 ppm
![]() Time Frame: Till 10 am
Time Frame: Till 10 am
![]() Health Impacts: Headaches, vomiting, & drowsiness.
Health Impacts: Headaches, vomiting, & drowsiness.

01
Moderate CO2 in School – Morning
Usually, the CO2 level in the early morning is moderate when the number of students and staff is not much. The range increases when the number of students and staff increases.
![]() CO2 Range: Between 400-1000 ppm
CO2 Range: Between 400-1000 ppm
![]() Time Frame: From 8 am – 12 pm
Time Frame: From 8 am – 12 pm
![]() Health Impacts: lifelong respiratory infections, unattentiveness, etc.
Health Impacts: lifelong respiratory infections, unattentiveness, etc.
02
Good CO2 in School – Evening
As the school day ends, there is a progressive decline in the number of students on the school grounds. When the ventilation rate is good, CO2 levels start to decline and the air quality begins to improve.
CO2 Range: ≤ 1000 ppm ![]()
Time Frame: Between 12-2 PM ![]()
Health Impacts: Cognitive, IQ skills, mental abilities of the child ![]()


03
Bad CO2 in School – Day (Afternoon)
An increase in the CO2 levels even by 100 ppm corresponds to a 0.2% increase in absence rates.
![]() CO2 Range: 2000 ppm.
CO2 Range: 2000 ppm.
![]() Time Frame: Between 12-2 PM
Time Frame: Between 12-2 PM
![]() Health Impacts: Cognitive, IQ skills, mental abilities of the child
Health Impacts: Cognitive, IQ skills, mental abilities of the child

01
Moderate CO2 in Office – Morning
Early in the morning, when working hour begins, CO2 levels are typical to moderate as the employees are not fully present.
![]() CO2 Range: 1000 ppm
CO2 Range: 1000 ppm
![]() Time Frame: From 9 am – 11 pm
Time Frame: From 9 am – 11 pm
![]() Health Impacts: Employees feel fresh and active when there are good to moderate CO2 levels.
Health Impacts: Employees feel fresh and active when there are good to moderate CO2 levels.
02
Bad CO2 in Office – Day (Afternoon)
As all the employees are present, then CO2 levels rise as a result of respiration and accumulate over time, they are in an unhealthy range.
CO2 Range: It can exceed up to 3000 ppm ![]()
Time Frame: between 12 pm – 4 pm ![]()
Health Impacts: Dizziness, loss of coordination, unattentiveness ![]()


03
Bad CO2 in School – Day (Afternoon)
An increase in the CO2 levels even by 100 ppm corresponds to a 0.2% increase in absence rates.
![]() CO2 Range: 2000 ppm.
CO2 Range: 2000 ppm.
![]() Time Frame: Between 12-2 PM
Time Frame: Between 12-2 PM
![]() Health Impacts: Cognitive, IQ skills, mental abilities of the child
Health Impacts: Cognitive, IQ skills, mental abilities of the child
Graph of CO2 Monitoring at Home
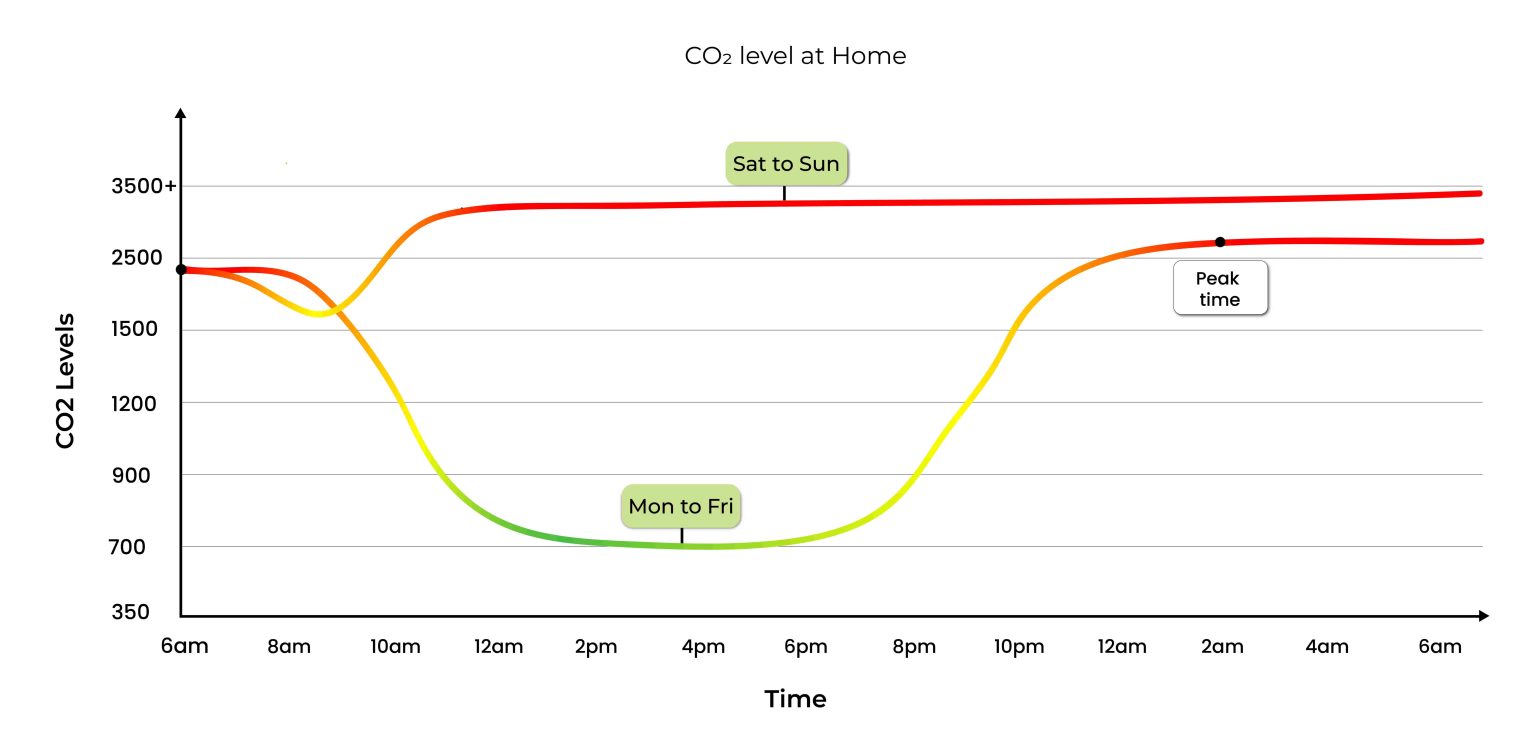
Note: The data shown on the above graph is on the base of a region where the sun rises at 5-6 am and sun sets at 7-8 pm around, and working days are Monday to Friday only. At home, the CO2 levels fall where adults and children are not present during day of Monday to Friday. It begins to rise again when occupancy increases in the evening.
Places Where There is High CO2 Level
It helps you understand the level of Carbon Dioxide of your location. Works as both – real-time indoor and outdoor CO2 monitoring sensor; the LCD display shows you CO2 reading indicating


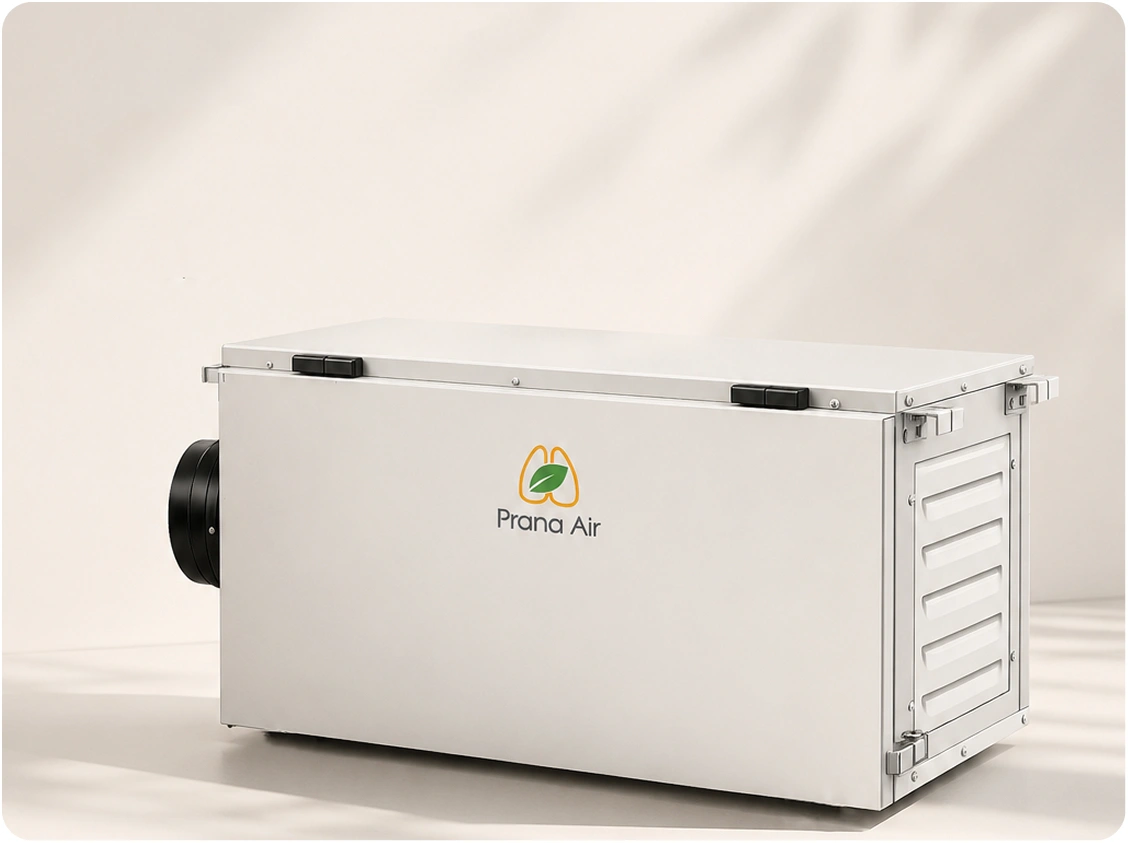
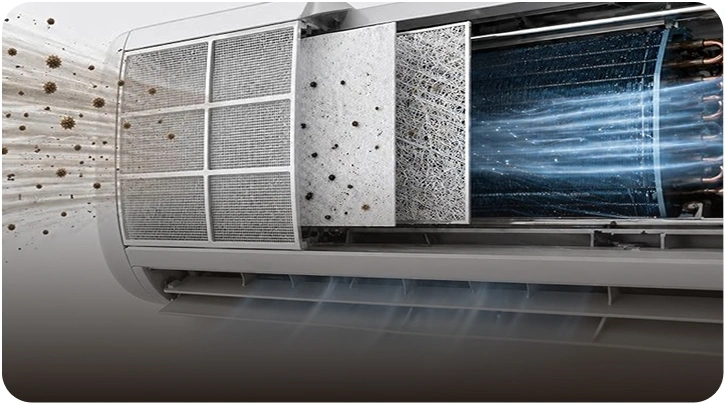
Clean Air Quality SolutionFresh Air Machine
Prana Air provides the solution to indoor air pollution with an air purifying machine to purify the air pollutants.
>>Learn More
Trusted By